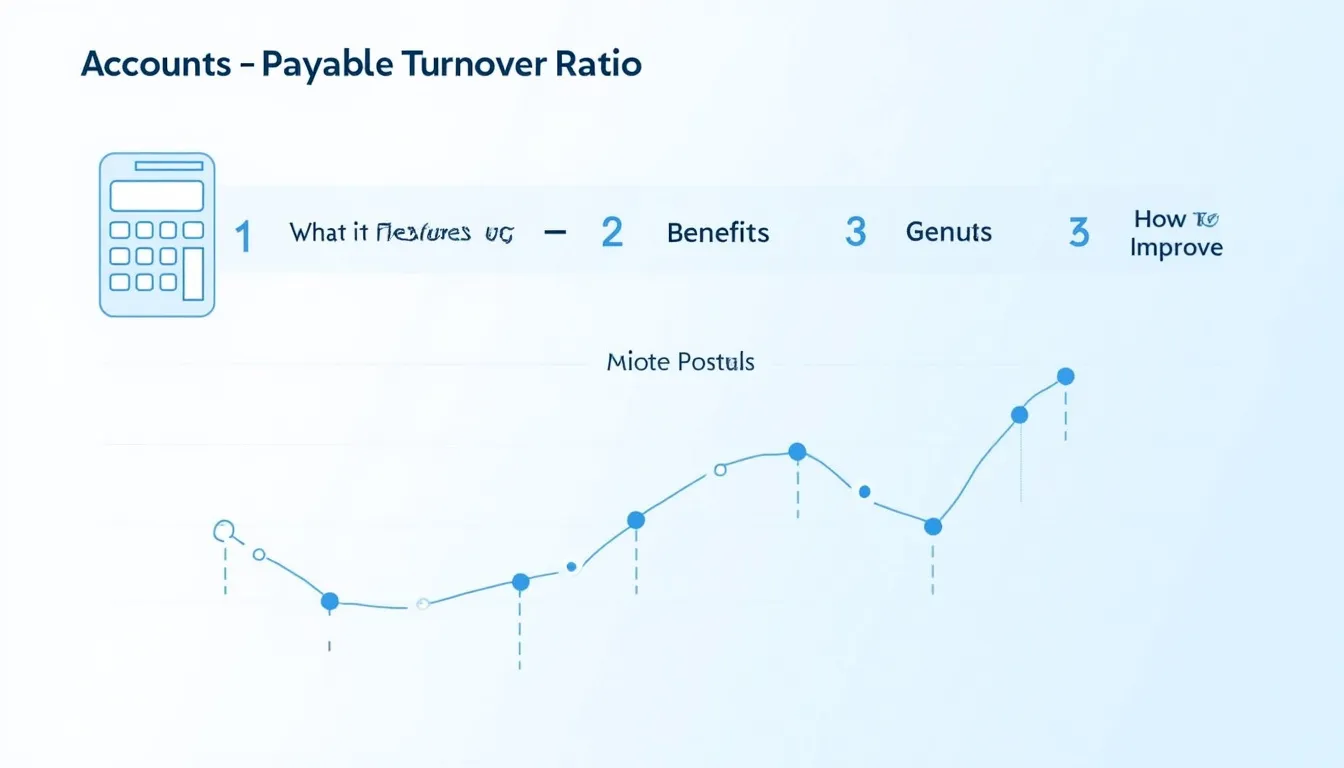
Accounts Payable Turnover Ratio Calculator
Is this tool helpful?
How to use the tool
- Total Supply Purchases. Enter what you spent on supplies this year, e.g., 220 000 USD or 910 500 USD.
- Beginning Accounts Payable. Type the opening liability, such as 65 000 USD or 120 000 USD.
- Ending Accounts Payable. Input the closing liability, for instance 85 000 USD or 110 000 USD.
- Press “Calculate.” The tool shows your turnover ratio, average payable, and the figures you entered.
Formula used
Average Accounts Payable
$$\text{Average AP}= rac{\text{Beginning AP}+\text{Ending AP}}{2}$$
Accounts Payable Turnover Ratio
$$\text{AP Turnover}= rac{\text{Total Supply Purchases}}{\text{Average AP}}$$
Example 1
- Total purchases: 220 000 USD
- Beginning AP: 65 000 USD
- Ending AP: 85 000 USD
Average AP = (65 000 + 85 000) / 2 = 75 000 USD
AP Turnover = 220 000 / 75 000 ≈ 2.93 times
Example 2
- Total purchases: 900 000 USD
- Beginning AP: 120 000 USD
- Ending AP: 110 000 USD
Average AP = (120 000 + 110 000) / 2 = 115 000 USD
AP Turnover = 900 000 / 115 000 ≈ 7.83 times
Quick-Facts
- Typical U.S. manufacturing turnover range: 6-12 times (CFMA Annual Benchmarks 2022).
- Common supplier terms: Net-30 days (PYMNTS “B2B Payments Guide” 2023).
- Average SME cash conversion cycle: 64 days (JP Morgan Working Capital Index 2022).
- Late-payment penalties may exceed 1.5 % per month (UCC §2-709).
FAQ
What is the Accounts Payable Turnover Ratio?
The ratio shows how many times you pay off supplier balances within a year, reflecting liquidity and payment discipline (Investopedia, https://www.investopedia.com/terms/a/accountspayableturnoverratio.asp).
Why does a higher ratio matter?
A higher figure signals quick payments, enhancing vendor trust and potentially securing discounts (Deloitte Working Capital Survey 2022).
What counts as “good”?
Manufacturers average 9-10 turns, retailers 7-8 turns; compare to peers rather than a fixed standard (CFMA 2022).
How do I lower the ratio safely?
Negotiate longer terms, schedule payments on due dates, and batch invoices to retain cash without harming relationships (SBA Cash Flow Guide 2023).
Is this ratio the same as Days Payable Outstanding?
No. DPO converts turnover into days with the formula 365 / AP Turnover (Corporate Finance Institute, 2023).
Which data do I need?
You need total supply purchases and the payables balance at the start and end of the chosen period—nothing else (AICPA “Liquidity Metrics” 2021).
How often should I check it?
Large firms review monthly; small businesses at least quarterly to catch deteriorating payment trends early (JP Morgan 2022).
Expert insight
“The AP turnover ratio is a key liquidity indicator that signals a firm’s ability to pay suppliers on time” (CSCMP Logistics Report 2022).
Important Disclaimer
The calculations, results, and content provided by our tools are not guaranteed to be accurate, complete, or reliable. Users are responsible for verifying and interpreting the results. Our content and tools may contain errors, biases, or inconsistencies. Do not enter personal data, sensitive information, or personally identifiable information in our web forms or tools. Such data entry violates our terms of service and may result in unauthorized disclosure to third parties. We reserve the right to save inputs and outputs from our tools for the purposes of error debugging, bias identification, and performance improvement. External companies providing AI models used in our tools may also save and process data in accordance with their own policies. By using our tools, you consent to this data collection and processing. We reserve the right to limit the usage of our tools based on current usability factors.


