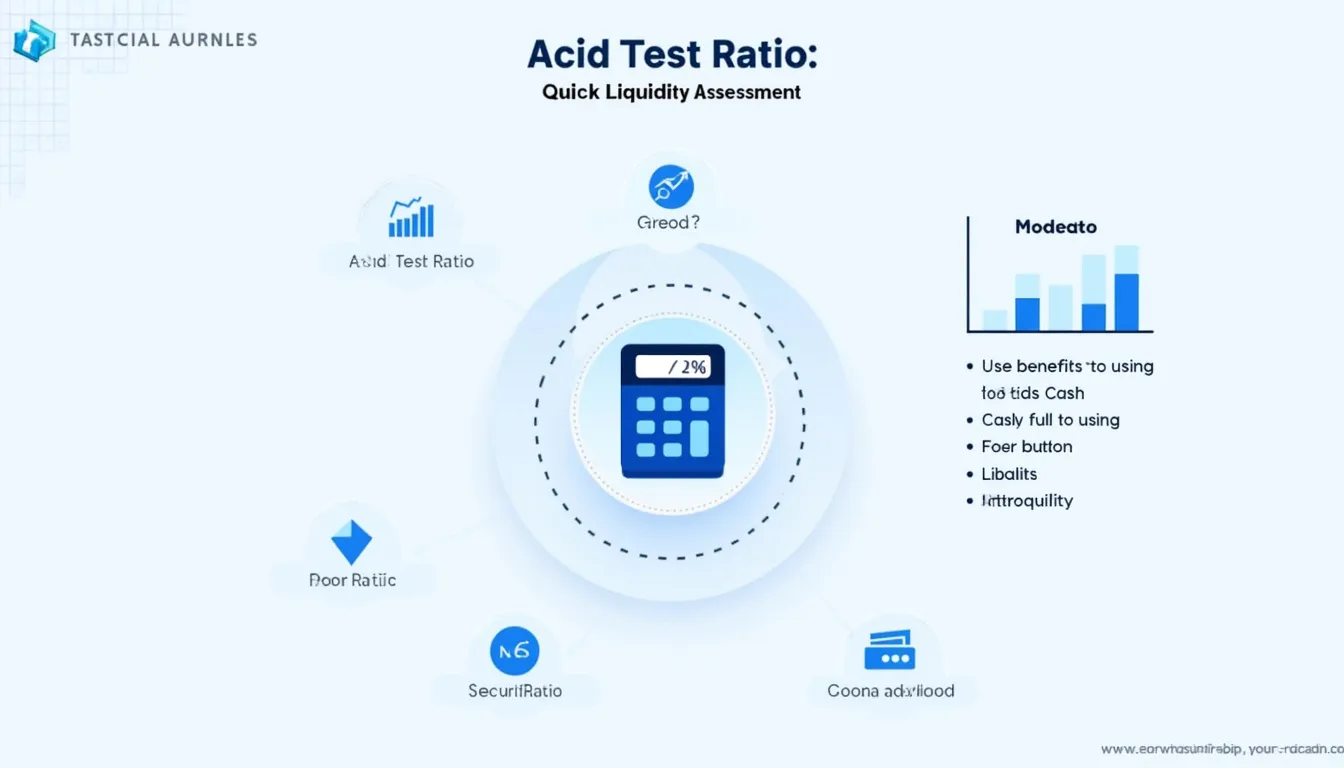
Acid Test Ratio Calculator
Is this tool helpful?
How to use the tool
Follow these steps to gauge your firm’s short-term liquidity:
- Cash & Cash Equivalents: Type values such as 18 750 or 33 420.
- Marketable Securities: Add amounts like 4 600 or 12 900.
- Accounts Receivable: Enter figures, e.g., 9 700 or 19 200.
- Current Liabilities: Provide debts due within 12 months, e.g., 25 400 or 41 800 (must exceed 0).
- Calculate: Press “Calculate” to obtain the ratio instantly.
- Interpret: A result above 1 signals ample liquid assets to meet near-term obligations.
Formula
Only the quickest assets feature in the computation:
$$ \text{Acid-Test Ratio}= rac{\text{Cash}+\text{Marketable Securities}+\text{Accounts Receivable}}{\text{Current Liabilities}} $$
Example calculation 1
$$ rac{18\,750+4\,600+9\,700}{25\,400}= rac{33\,050}{25\,400}=1.30$$
The firm holds $1.30 in liquid assets for every $1 of short-term debt.
Example calculation 2
$$ rac{33\,420+12\,900+19\,200}{41\,800}= rac{65\,520}{41\,800}=1.57$$
A ratio of 1.57 reflects stronger liquidity.
Quick-Facts
- An acid-test ratio above 1 is generally viewed as healthy (Investopedia, 2023).
- The median quick ratio for U.S. non-financial firms was 1.15 in 2022 (Damodaran, 2023).
- Inventory forms roughly 31 % of current assets in manufacturing companies (U.S. Census ASM 2022).
- “Current liabilities are those due within twelve months” (IAS 1, IASB 2020).
- The calculator is free and processes data locally—no upload required.
FAQ
What does the acid-test ratio show?
The ratio reveals how many dollars of instantly liquid assets you hold for every dollar of short-term debt, spotlighting your ability to pay bills without selling inventory (Investopedia, https://www.investopedia.com/terms/q/quickratio.asp).
How is it different from the current ratio?
The current ratio includes inventory and prepaid expenses; the acid-test ratio excludes them, giving a stricter view of liquidity (Harvard Business Review, 2021).
What is a “good” acid-test ratio?
Analysts consider 1.0-2.0 acceptable for most service and tech firms, while capital-intensive sectors average closer to 0.9 (Damodaran, 2023).
Can the ratio be too high?
Yes. A score above 3 can hint at idle cash that could earn higher returns elsewhere (McKinsey Quarterly, 2022).
How do you improve a low ratio?
Speed up collections, renegotiate payment terms, or convert unused inventory to cash to lift liquid assets (Small Business Administration, 2022).
Does industry matter?
Absolutely. Retailers with fast inventory turnover can operate safely at 0.7, while consulting firms typically target 1.5 (PwC Working Capital Report 2023).
Should I exclude doubtful receivables?
Yes. GAAP advises subtracting doubtful accounts to avoid overstating liquidity (FASB ASC 310-10-35).
How often should I check the ratio?
Monthly reviews align with most cash-flow cycles and enable timely corrective action (CFO Magazine, 2023).
Important Disclaimer
The calculations, results, and content provided by our tools are not guaranteed to be accurate, complete, or reliable. Users are responsible for verifying and interpreting the results. Our content and tools may contain errors, biases, or inconsistencies. Do not enter personal data, sensitive information, or personally identifiable information in our web forms or tools. Such data entry violates our terms of service and may result in unauthorized disclosure to third parties. We reserve the right to save inputs and outputs from our tools for the purposes of error debugging, bias identification, and performance improvement. External companies providing AI models used in our tools may also save and process data in accordance with their own policies. By using our tools, you consent to this data collection and processing. We reserve the right to limit the usage of our tools based on current usability factors.
