Is this tool helpful?
How to Use the Article Structure Analysis Tool Effectively
Follow these steps to get the most accurate and helpful analysis from the Article Structure Analysis Tool:
- Enter the Article URL: Paste the full URL of the article you want to analyze. For example, use https://www.techinsights.com/blockchain-trends-2024 or https://www.healthnews.com/nutrition-myths-debunked.
- Provide the Article Title: Type the exact title as it appears on the webpage. For example, “Emerging Blockchain Trends in 2024” or “Top 10 Nutrition Myths Busted”.
- Specify the Main Topic: Briefly describe the primary subject of the article. For instance, enter “Blockchain technology advancements” or “Common misconceptions in nutrition”.
- Define the Target Audience (Optional): If you know the readers you want to reach, specify them. For example, technology enthusiasts, financial analysts or health-conscious individuals, dietitians.
- List Key SEO Keywords (Optional): Enter SEO keywords separated by commas. For example, blockchain security, crypto trends, decentralized finance or nutrition facts, diet myths, healthy eating tips.
- Click “Analyze Article Structure”: Submit the form to get a detailed report highlighting where to place images and other visual content to improve readability and engagement.
After submission, you’ll receive actionable suggestions for adding images, infographics, and other visuals that boost your article’s SEO performance and reader retention. You can copy this analysis and implement the recommendations directly into your content strategy.
Introducing the Article Structure Analysis Tool: Boost Your Content with Strategic Visuals
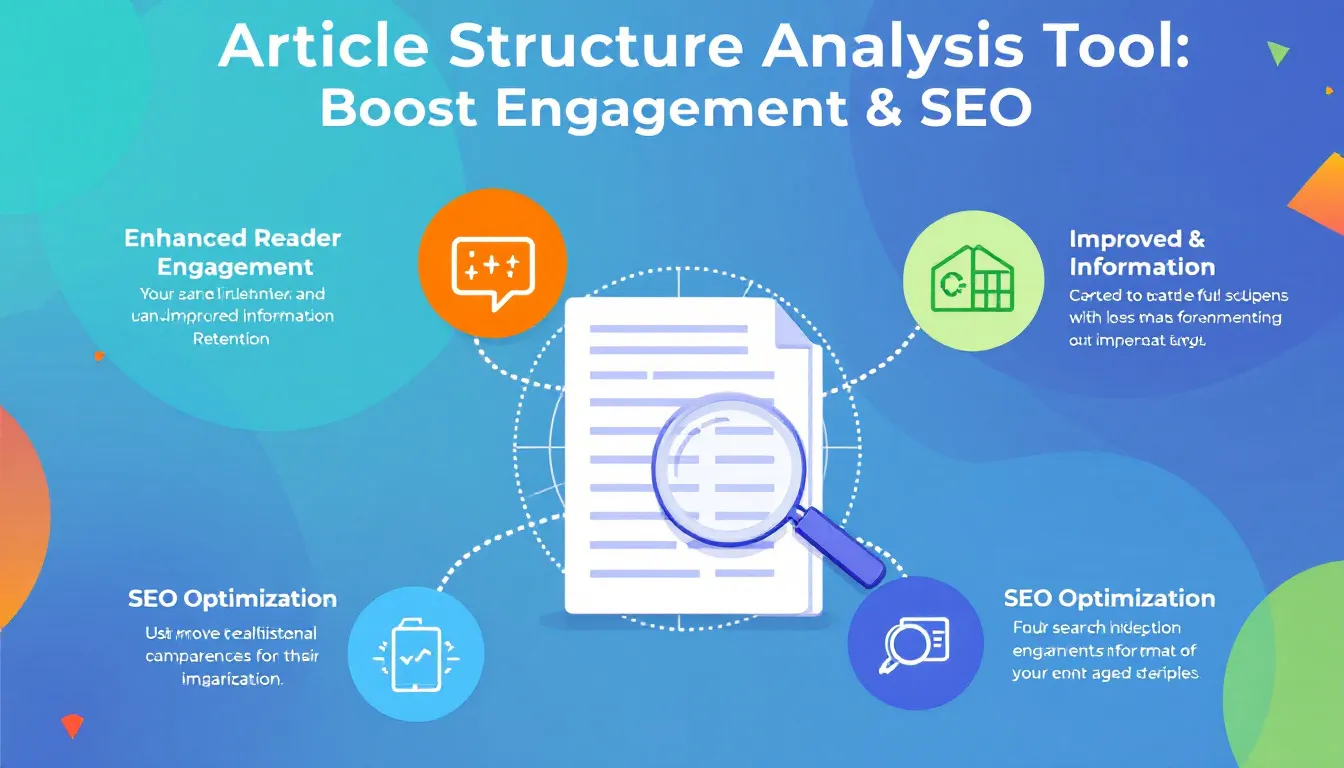
The Article Structure Analysis Tool helps you transform your written content into engaging, reader-friendly experiences by identifying key spots for visuals like images and infographics. These visual enhancements increase user engagement, improve comprehension, and strengthen your search engine optimization.
By analyzing your article’s layout, flow, and complexity, the tool provides tailored recommendations for where and how to insert visuals that support your message. This makes your content easier to read, more attractive, and more likely to keep readers on your page longer.
Why Visual Content Matters
Research shows that visuals significantly boost information retention and engagement. The brain processes images faster than text, making visuals ideal for explaining complex concepts and breaking up large blocks of information. Using strategically placed images makes your article feel less dense and helps readers absorb your key points faster.
Key Benefits of Using This Tool
- Increase Reader Engagement: The tool highlights where to add visuals that keep readers interested and encourage them to spend more time on your page.
- Enhance Information Retention: By reinforcing important ideas with images and infographics, your readers remember your content better.
- Improve SEO: Well-placed images with proper alt text improve your article’s search engine ranking and organic traffic.
- Save Time and Resources: Instead of guessing where to add visuals, the tool provides clear, data-driven suggestions that simplify the process.
- Maintain Visual Consistency: Use the tool regularly to keep a cohesive visual style across all your content.
Practical Uses and Real-World Applications
Content Marketing Strategy Enhancement
Marketers use this tool to optimize blog posts and long-form articles by adding visuals that clarify and support key marketing messages. This leads to increased time on site and shares on social media platforms.
Educational Content Improvement
Educators and e-learning creators rely on the tool to add explanatory charts, diagrams, and step-by-step visuals that simplify technical subjects. This approach boosts learner engagement and knowledge retention.
E-Commerce Product Pages
Online retailers enhance product descriptions by incorporating detailed product images and comparison infographics suggested by the tool, resulting in higher conversion rates and fewer returns.
Frequently Asked Questions About the Article Structure Analysis Tool
How does the tool decide where to place images?
It analyzes your article’s paragraphs, topics, and complexity to find natural breaks and key concepts that benefit from visual support. The tool ensures visuals improve the flow and comprehension of your content.
Can the tool suggest specific types of visuals to use?
Yes. Depending on the content, it may recommend photographs, charts, infographics, diagrams, or interactive elements that clarify or highlight important points.
Is the tool suitable for all content types?
While it works best for long-form and complex articles, the tool is valuable for most online content that benefits from added visuals to improve readability and SEO.
How do I ensure visuals align with my brand identity?
The tool guides where and what type of image to add, but you select images that match your brand style and guidelines, ensuring consistency across your content.
Will adding more images slow down my website?
Modern image optimization techniques keep load times fast. The tool emphasizes strategic placement rather than excessive visuals, balancing user experience and performance.
Conclusion: Improve Your Content Strategy with Thoughtful Visual Placement
Using the Article Structure Analysis Tool helps you create content that’s easier to read, more engaging, and better optimized for search engines. Strategic visuals guide your readers through complex topics, reduce bounce rates, and encourage sharing.
Incorporate this tool into your content workflow to:
- Enhance reader engagement and comprehension
- Boost your SEO rankings with well-structured, visually rich articles
- Clarify complex subjects for broader audience understanding
- Increase content shareability on social media platforms
- Maintain a consistent and professional visual style across content
Important Disclaimer
The calculations, results, and content provided by our tools are not guaranteed to be accurate, complete, or reliable. Users are responsible for verifying and interpreting the results. Our content and tools may contain errors, biases, or inconsistencies. Do not enter personal data, sensitive information, or personally identifiable information in our web forms or tools. Such data entry violates our terms of service and may result in unauthorized disclosure to third parties. We reserve the right to save inputs and outputs from our tools for the purposes of error debugging, bias identification, and performance improvement. External companies providing AI models used in our tools may also save and process data in accordance with their own policies. By using our tools, you consent to this data collection and processing. We reserve the right to limit the usage of our tools based on current usability factors.
