Asset Turnover Ratio Calculator
Is this tool helpful?
How to use the tool
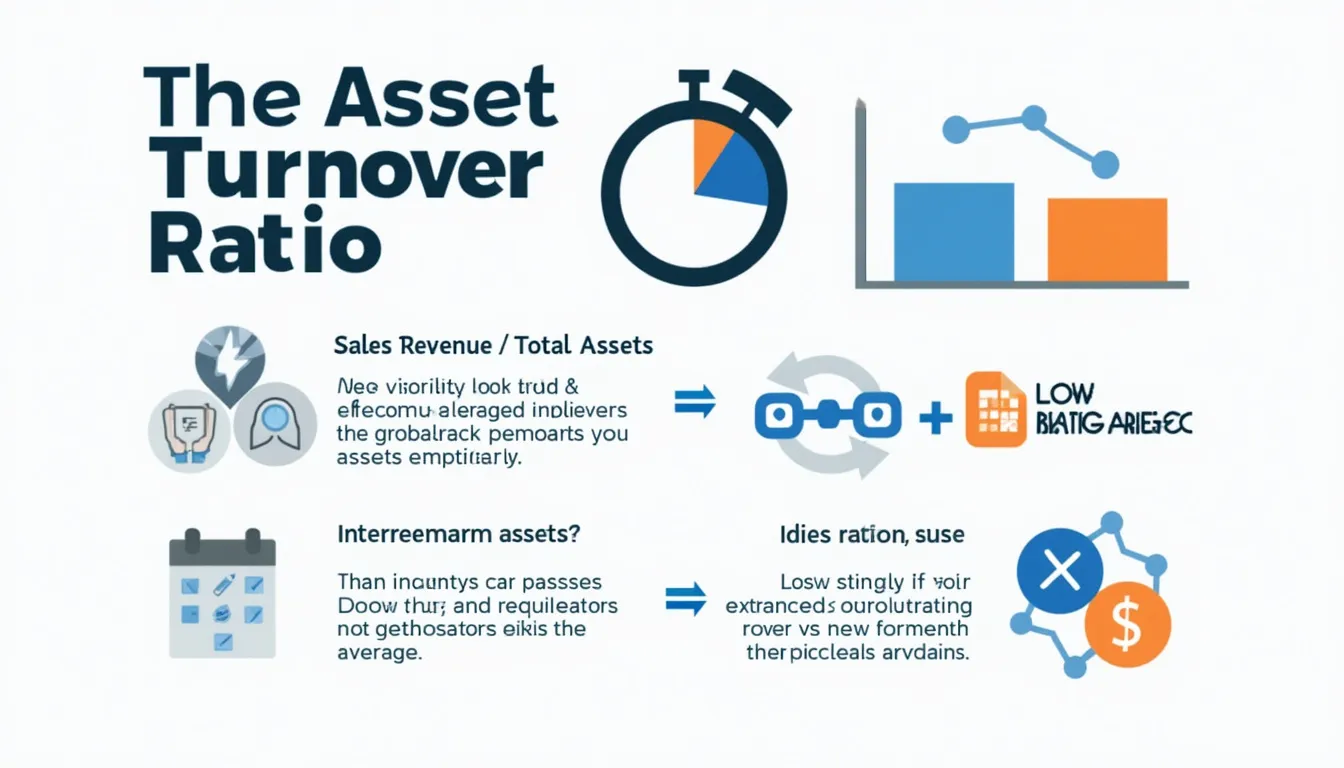
- Fill in Sales Revenue: Type your gross sales for the chosen period, e.g., 3 000 000 or 950 000.
- Enter Total Assets: Add the average asset value for the same period, e.g., 1 500 000 or 2 300 000.
- Press Calculate: The tool divides revenue by assets and displays the ratio instantly.
- Read the result: A ratio above the sector benchmark signals efficient asset use; below means room for improvement.
Formula
$$ \text{Asset Turnover Ratio} = rac{\text{Sales Revenue}}{\text{Total Assets}} $$
Worked examples
- Example A: 3 000 000 ÷ 1 500 000 = 2.00 → every dollar of assets produces $2.00 in sales.
- Example B: 950 000 ÷ 2 300 000 = 0.41 → assets generate $0.41 per dollar invested.
Quick-Facts
- Average U.S. asset turnover across sectors: 0.79 (Damodaran, 2023).
- Retail (general) tops 2.17 (Damodaran, 2023).
- Manufacturing median ≈ 0.56 (PwC “Industrial Metrics”, 2022).
- High ratios usually pair with low profit margins (Investopedia, URL).
- IFRS recommends using average annual assets for consistency (IFRS Standards IAS 1, 2021).
FAQ
What is the Asset Turnover Ratio?
It divides sales revenue by total assets to reveal asset efficiency (CFA Institute, 2020).
How do I read a high or low ratio?
Above-benchmark ratios show strong asset use; low ones flag idle capacity (Damodaran, 2023).
Which industries post the highest ratios?
Food and general retail exceed 2.0, reflecting fast inventory cycles (US Census Retail Indicators, 2022).
How often should I run the calculation?
Quarterly reviews track operational changes; annual figures suit formal reporting (SEC Guide, 2022).
Does depreciation change the ratio?
Yes; lower book assets raise the ratio even if sales stay flat (IAS 16, 2021).
Can the ratio be negative?
No; both inputs are non-negative by definition, so the quotient stays zero or positive (Investopedia, URL).
How can I improve my ratio?
Boost sales, cut idle assets, or outsource asset-heavy processes (McKinsey “Operations Benchmark”, 2023).
Is cross-industry comparison valid?
Use industry peers only; capital intensity distorts cross-sector benchmarks (PwC “Industrial Metrics”, 2022).
Important Disclaimer
The calculations, results, and content provided by our tools are not guaranteed to be accurate, complete, or reliable. Users are responsible for verifying and interpreting the results. Our content and tools may contain errors, biases, or inconsistencies. Do not enter personal data, sensitive information, or personally identifiable information in our web forms or tools. Such data entry violates our terms of service and may result in unauthorized disclosure to third parties. We reserve the right to save inputs and outputs from our tools for the purposes of error debugging, bias identification, and performance improvement. External companies providing AI models used in our tools may also save and process data in accordance with their own policies. By using our tools, you consent to this data collection and processing. We reserve the right to limit the usage of our tools based on current usability factors.
