Is this tool helpful?
How to Use the Brand Health Score Calculator Effectively
The Brand Health Score Calculator features several input fields that collectively measure your brand’s overall health and market performance. Here’s a step-by-step guide to using each field:
- Brand Awareness Score: Enter the percentage of your target audience who recognize your brand. For example, if 750 out of 1,000 survey respondents recognize your brand, enter 75%.
- Brand Consideration Score: Input the percentage of potential customers who would consider purchasing from your brand. For instance, if 450 out of 900 respondents would consider your brand, enter 50%.
- Brand Preference Score: Enter the percentage of consumers who prefer your brand over competitors. If 300 out of 800 respondents prefer your brand, input 37.5%.
- Brand Loyalty Score: Input your customer retention rate. For example, if 280 out of 400 customers make repeat purchases, enter 70%.
- Net Promoter Score (NPS): Enter your NPS value between -100 and +100.
- Customer Satisfaction Score (CSAT): Input your CSAT percentage.
- Brand Equity Score: Enter your current brand equity score.
- Maximum Brand Equity Score: Input the maximum possible brand equity score for standardization.
Understanding Brand Health Score Calculation
The Brand Health Score combines multiple brand metrics using a weighted average formula:
$$\text{Brand Health Score} = (BA × 0.20) + (BC × 0.15) + (BP × 0.15) + (BL × 0.20) + (NPS_s × 0.15) + (CSAT × 0.10) + (BE_s × 0.05)$$
Where:
- BA = Brand Awareness Score
- BC = Brand Consideration Score
- BP = Brand Preference Score
- BL = Brand Loyalty Score
- NPS_s = Standardized Net Promoter Score
- BE_s = Standardized Brand Equity Score
Standardization Formulas
$$\text{Standardized NPS} = \frac{NPS + 100}{200} × 100$$
$$\text{Standardized Brand Equity} = \frac{\text{Brand Equity Score}}{\text{Maximum Brand Equity Score}} × 100$$
Benefits of Using the Brand Health Score Calculator
- Comprehensive brand performance assessment through multiple metrics
- Visual representation through bar and radar charts for better insights
- Standardized scoring system for consistent measurement
- Easy identification of areas requiring improvement
- Benchmark creation for tracking brand progress
- Data-driven decision making for brand strategy
Practical Applications and Examples
Example 1: Growing Tech Startup
Input values:
- Brand Awareness: 45%
- Brand Consideration: 35%
- Brand Preference: 20%
- Brand Loyalty: 55%
- NPS: 25
- CSAT: 85%
- Brand Equity: 60 (max: 100)
Resulting Brand Health Score: 51.25% (Average)
Example 2: Established Retail Brand
Input values:
- Brand Awareness: 85%
- Brand Consideration: 70%
- Brand Preference: 45%
- Brand Loyalty: 75%
- NPS: 45
- CSAT: 90%
- Brand Equity: 85 (max: 100)
Resulting Brand Health Score: 75.88% (Good)
Strategic Decision Making with Brand Health Score
Interpreting Results
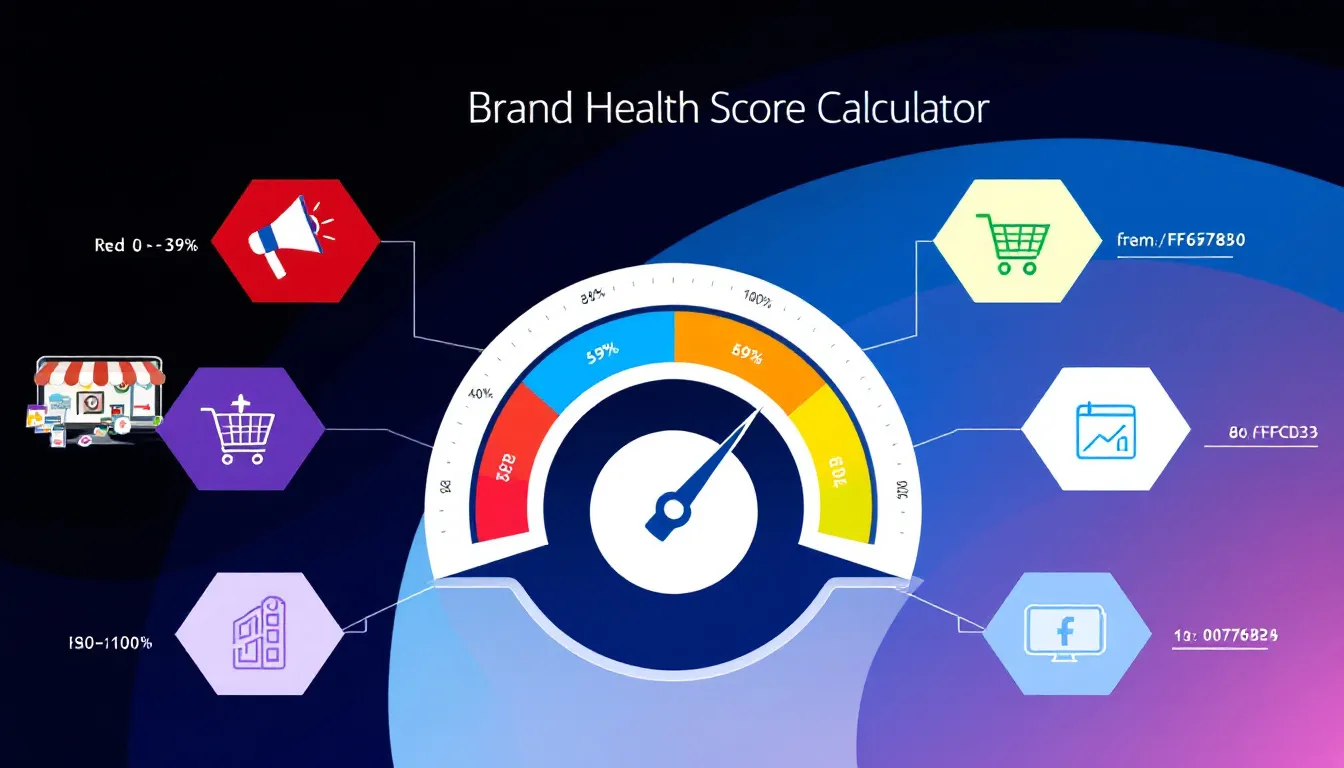
- Excellent (80-100%): Strong brand performance across all metrics
- Good (60-79%): Solid performance with room for optimization
- Average (40-59%): Moderate performance requiring attention
- Poor (Below 40%): Significant improvement needed
Action Planning
- Low Brand Awareness: Increase marketing and advertising efforts
- Low Consideration: Enhance value proposition communication
- Low Preference: Improve competitive differentiation
- Low Loyalty: Focus on customer experience and retention programs
- Low NPS: Address customer feedback and pain points
- Low CSAT: Improve product/service quality and customer support
- Low Brand Equity: Strengthen brand positioning and perception
Frequently Asked Questions
What is a good Brand Health Score?
A score above 60% is considered good, with scores above 80% being excellent. However, the interpretation should consider industry standards and competitive landscape.
How often should I measure Brand Health Score?
Quarterly measurements are recommended for most businesses, with monthly tracking for brands undergoing significant changes or campaigns.
Can I customize metric weightings?
While the calculator uses predetermined weights, businesses can adjust their internal calculations based on strategic priorities and industry specifics.
How do I collect the required data?
Data can be gathered through customer surveys, market research, sales data, customer feedback systems, and brand tracking studies.
What actions should I take if my score is low?
Focus on the metrics with the lowest scores first. Develop targeted strategies for improvement and monitor progress regularly.
How does Brand Health Score relate to business performance?
A strong Brand Health Score typically correlates with better business performance, including higher customer acquisition rates, retention, and revenue growth.
Maximizing Value from Your Brand Health Score
Best Practices
- Regular monitoring and tracking of scores over time
- Benchmarking against industry standards
- Setting realistic improvement targets
- Creating action plans for low-performing metrics
- Involving key stakeholders in improvement initiatives
- Documenting and sharing insights across teams
Integration with Business Strategy
- Align brand health goals with business objectives
- Use insights to inform marketing strategy
- Guide resource allocation based on metric performance
- Develop targeted improvement initiatives
- Create accountability for brand performance
Important Disclaimer
The calculations, results, and content provided by our tools are not guaranteed to be accurate, complete, or reliable. Users are responsible for verifying and interpreting the results. Our content and tools may contain errors, biases, or inconsistencies. We reserve the right to save inputs and outputs from our tools for the purposes of error debugging, bias identification, and performance improvement. External companies providing AI models used in our tools may also save and process data in accordance with their own policies. By using our tools, you consent to this data collection and processing. We reserve the right to limit the usage of our tools based on current usability factors. By using our tools, you acknowledge that you have read, understood, and agreed to this disclaimer. You accept the inherent risks and limitations associated with the use of our tools and services.
