Is this tool helpful?
How to Use the Brand Perception Analysis Tool Effectively
Follow these simple steps to get clear, actionable insights from the Brand Perception Analysis Tool. Accurate inputs lead to better understanding of your brand’s market position and customer views.
Step 1: Enter Brand Name
- Type the official brand name you want to evaluate. Examples: “Patagonia” or “Whole Foods”.
- Avoid using slogans or extra descriptors to keep results focused.
Step 2: Define Brand Positioning and Core Values
- Explain your brand’s target market position and what it represents. For example:
- “Eco-friendly outdoor apparel promoting sustainability and adventure.”
- “Health-focused grocery chain offering organic and local products.”
Step 3: Add Customer Survey Data
- Include results from customer surveys, interviews, or feedback forms.
- Mix quantitative data such as ratings with qualitative comments or testimonials.
- Highlight key points clearly for better analysis.
Step 4: Provide Social Media Insights
- Share social media monitoring information like sentiment trends and popular conversation topics.
- Include details on engagement rates, hashtag success, and customer discussions.
What Is the Brand Perception Analysis Tool?
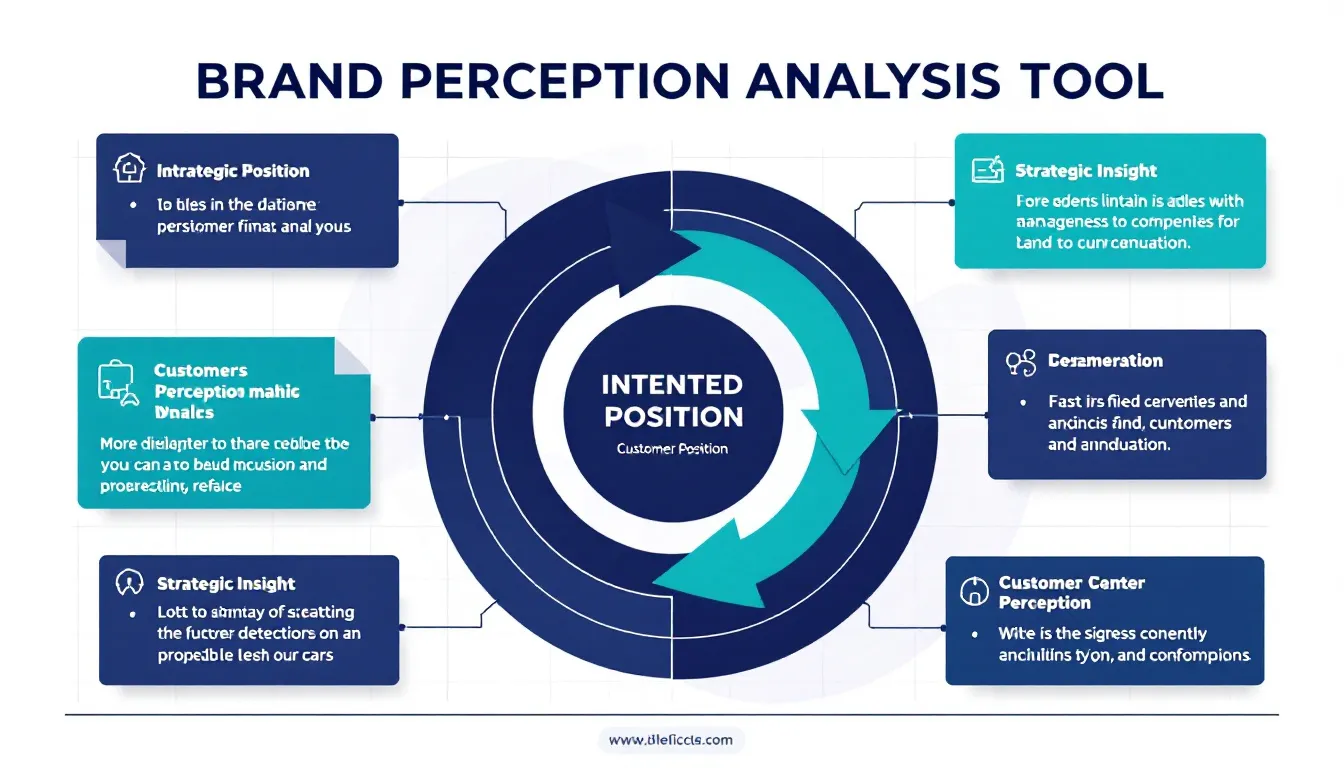
This tool helps you understand how your customers perceive your brand versus how you want it to be seen. It consolidates input from surveys, social media, and positioning statements to deliver a comprehensive view of your brand reputation.
By using this tool, you can identify gaps in perception, uncover blind spots in your marketing strategy, and improve customer alignment with your core brand message. It’s designed to support data-driven decisions that enhance brand loyalty and market positioning.
Key Benefits of Using This Brand Perception Analysis Tool
- Strategic Clarity: Understand exactly how your brand image aligns with customer views.
- Customer Insight: Discover what customers truly think about your products and services.
- Competitive Edge: Identify opportunities to differentiate your brand based on real perceptions.
- Improved Marketing ROI: Focus resources on areas that strengthen brand reputation.
- Better Customer Experiences: Bridge the gap between promise and delivery to build loyalty.
Practical Use of the Brand Perception Analysis Tool
Enter your data into the form fields, and the tool processes the information to generate insights aligned with your intended positioning. You receive a detailed report highlighting perception gaps and sentiment analysis results from social media data.
Gap Analysis Formula
Measure the difference between your intended brand image and customer perception:
$$\text{Perception Gap Score} = \text{Intended Position Rating} – \text{Actual Customer Perception Rating}$$
Sentiment Analysis Calculation
Calculate overall social sentiment using this formula:
$$\text{Net Sentiment Score} = \frac{\text{Positive Mentions} – \text{Negative Mentions}}{\text{Total Mentions}} \times 100$$
Example Application
Imagine a regional coffee shop that positions itself as a “community-driven, artisan coffee brand.” After analyzing customer feedback and social media sentiment, the tool finds that customers perceive it mainly as a “convenient but generic café.” This helps the brand focus on enhancing personalized service and community events to close the perception gap.
Understanding Brand Perception and Why It Matters
Brand perception reflects how customers interpret a brand’s identity, values, and offerings. It shapes purchasing decisions, loyalty, and word-of-mouth referrals. Effective perception analysis helps align what your brand promises with what customers actually experience.
Core Elements of Brand Perception
- Brand awareness and recall
- Emotional connections and associations
- Quality and value perceptions
- Brand personality traits
- Customer loyalty and advocacy levels
Benefits You Gain from Brand Perception Analysis
1. Build Stronger Brand Strategies
Understand where your brand stands from the customer’s perspective for sharper, more targeted brand development.
2. Increase Market Differentiation
Use customer insights to carve a unique position and communicate distinct brand attributes.
3. Optimize Marketing Spend
Invest in initiatives that truly affect customer perceptions and improve brand reputation.
4. Enhance Customer Engagement
Bridge gaps between expectations and experiences to foster loyalty and positive customer relations.
Common Brand Perception Challenges Addressed
Identifying Perception Gaps
The tool highlights areas where customer views don’t match your brand’s intended message, helping you prioritize improvements.
Integrating Sentiment from Social Media
Social listening inputs reveal how your brand is discussed publicly, capturing real-time sentiment shifts and trends.
Real-World Examples of Brand Perception Analysis
Example 1: Hospitality Chain Rebranding
- Intended message: “Affordable luxury with personalized guest service.”
- Customer perception: “Competent but impersonal experience.”
- Key perception scores: Guest interaction 6.4/10, room quality 7.5/10, pricing value 7.0/10.
Example 2: Software Startup Brand Shift
- Starting image: “Simple yet limited features.”
- Repositioning intent: “Innovative, scalable, and customer-centric.”
- Post-update perception: “User-friendly with growing functionality.”
Frequently Asked Questions About Brand Perception Analysis
How often should I analyze brand perception?
Run a full analysis at least quarterly. Add ongoing social listening to keep track of changes between reports, and conduct additional reviews after major campaigns.
What is the ideal survey sample size?
Aim for 300-500 responses representing key customer segments to ensure reliable insights and statistical relevance.
How can I address negative brand perceptions?
Target specific perception gaps, improve messaging consistency, and enhance customer interactions throughout all touchpoints.
Can I use this tool for multiple brands or product lines?
Yes, analyze each brand or line separately to understand distinct customer perceptions and tailor strategies accordingly.
Should I consider internal stakeholder views during analysis?
Including employee and management perspectives helps identify alignment issues and improves internal brand advocacy.
Strategic Guidelines for Implementing Brand Perception Analysis
1. Data Collection Best Practices
- Use consistent scales and questions across surveys.
- Schedule regular social media monitoring.
- Keep detailed records of customer feedback and interactions.
2. Structured Analysis Approach
- Compare results with industry benchmarks.
- Track trends over time to spot shifts in perception.
- Segment data by demographics for targeted insights.
3. Action and Measurement Planning
- Prioritize gaps based on business impact and feasibility of change.
- Create targeted plans to address perception weaknesses.
- Set measurable goals and track progress regularly.
Important Disclaimer
The calculations, results, and content provided by our tools are not guaranteed to be accurate, complete, or reliable. Users are responsible for verifying and interpreting the results. Our content and tools may contain errors, biases, or inconsistencies. Do not enter personal data, sensitive information, or personally identifiable information in our web forms or tools. Such data entry violates our terms of service and may result in unauthorized disclosure to third parties. We reserve the right to save inputs and outputs from our tools for the purposes of error debugging, bias identification, and performance improvement. External companies providing AI models used in our tools may also save and process data in accordance with their own policies. By using our tools, you consent to this data collection and processing. We reserve the right to limit the usage of our tools based on current usability factors.
