Category Correlation Calculator

The Correlation Calculator is an essential tool for businesses and professionals seeking to analyze relationships between variables in their datasets. This powerful calculator computes the correlation coefficient between two sets of data, providing valuable insights into the strength and direction of their relationship. Users can expect a comprehensive interpretation of the results, helping them make informed decisions based on data-driven analysis. The tool also generates a scatter plot with a trend line, offering a clear visual representation of the relationship between variables. For businesses looking to optimize their strategies or researchers aiming to validate hypotheses, this Correlation Calculator streamlines the process of identifying and understanding complex data relationships. Explore the potential of your data today and uncover meaningful insights with our user-friendly Correlation Calculator.

Correlation Coefficient Calculator: Analyze Relationships Between Variables
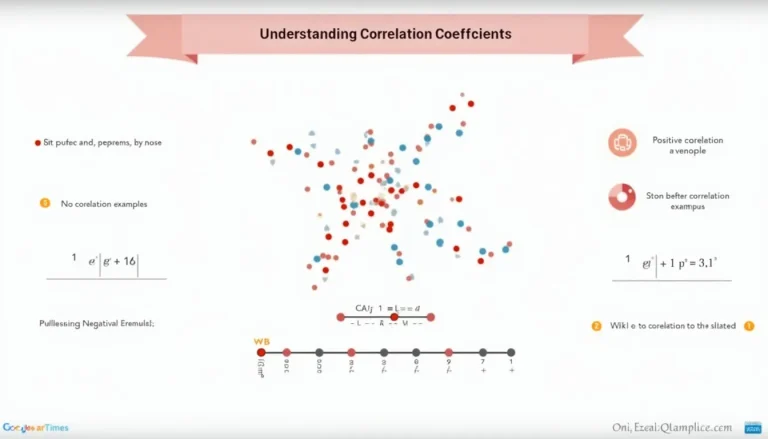
Decode the mysteries of correlation coefficients with this comprehensive infographic, illustrating key concepts from -1 to +1.

Our correlation calculator compares two numeric lists, outputs Pearson’s r, an interpretation, and a scatter plot. Paste or upload paired values—e.g., 4, 9, 11, 14 for X and 8, 11, 14, 18 for Y—then click “Calculate”. When |r| ≥ 0.7, the link is considered strong (NIST e-Handbook, https://itl.nist.gov/div898/handbook/eda/section3/eda33b.htm). Use it to confirm trends quickly in school, lab, or business work.

Go toCorrelation Coefficient Calculator: Analyze Relationships Between Variables

Correlation Coefficient Calculator: Analyze Relationships Between Variables

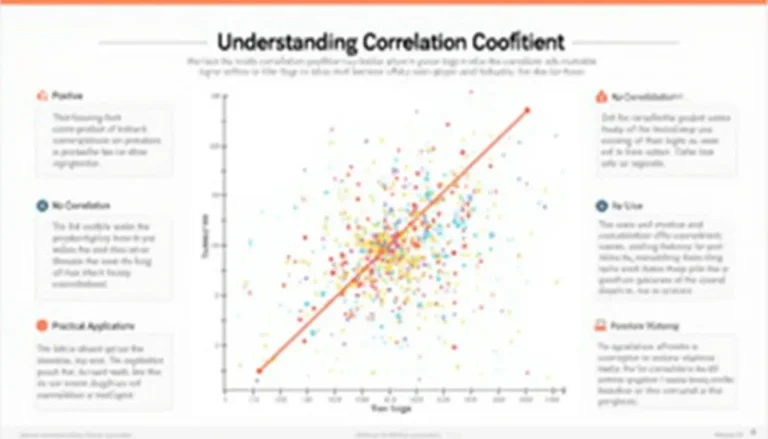
Dive into the world of data relationships with this comprehensive infographic on correlation coefficients, from basics to real-world applications.

Calculate how tightly two variables move together with a Pearson correlation coefficient (r). Enter paired numbers, press “Calculate,” and the tool returns r (-1 to +1), an interpretation, and a scatter plot—instantly for up to 1 000 pairs. Roughly 30 data pairs give stable estimates (NIST, 2013). A perfect fit (|r| = 1) means 100 % of the variation is explained by the line (ISO 3534-2:2006).

Go toCorrelation Coefficient Calculator: Analyze Relationships Between Variables