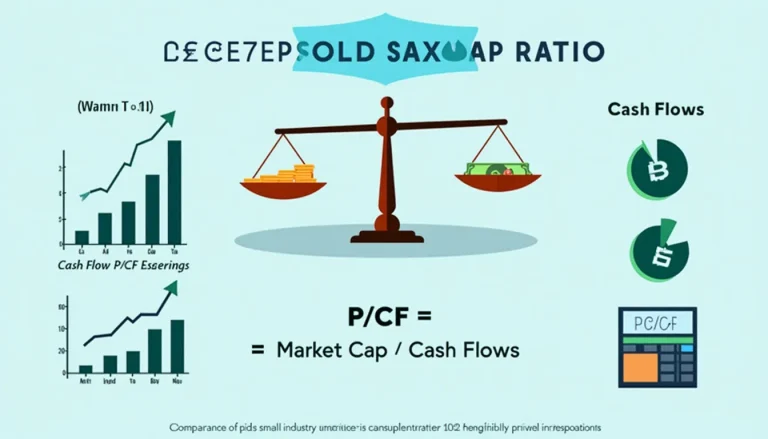
Price to Cash Flows Ratio Calculator: Evaluate Company Value Easily

Use the calculator in three steps: enter market cap, enter operating cash flow, press “Calculate.” A ratio under 15 is cheaper than the 2023 S&P 500 median of 17.5 (FactSet, 2023).
The Price to Cash Flows Ratio Calculator is an essential financial tool designed to help investors and analysts evaluate company valuations by comparing market price to operating cash flows. This powerful calculator simplifies the process of determining whether a company’s stock is potentially overvalued or undervalued based on its cash-generating ability. By analyzing the relationship between a company’s stock price and its cash flows, users can make more informed investment decisions and compare companies within the same industry more effectively. The calculator provides quick, accurate results that help professionals assess investment opportunities and perform comprehensive financial analysis. Whether you’re a financial analyst, investor, or business professional, this tool streamlines the valuation process and helps you make data-driven decisions. Start using our Price to Cash Flows Ratio Calculator today to enhance your investment analysis toolkit.

Use the calculator in three steps: enter market cap, enter operating cash flow, press “Calculate.” A ratio under 15 is cheaper than the 2023 S&P 500 median of 17.5 (FactSet, 2023).