Category Variance Calculator

The Variance Calculator is a comprehensive statistical tool designed to help professionals and researchers analyze the spread and variability within their datasets. This powerful calculator enables users to compute both population and sample variance, providing detailed step-by-step calculations that make complex statistical analysis accessible to everyone. With built-in data visualization features, users can better understand and interpret their results through clear graphical representations. Whether you’re conducting market research, analyzing scientific data, or performing quality control measurements, this tool streamlines the process of statistical analysis while ensuring accuracy and reliability. For businesses and organizations seeking to make data-driven decisions, our Variance Calculator offers an efficient and user-friendly solution to quantify data dispersion and variability in their datasets. Try our calculator today to transform your raw data into meaningful statistical insights.

Variance Calculator: Analyze Data Spread with Population & Sample Options
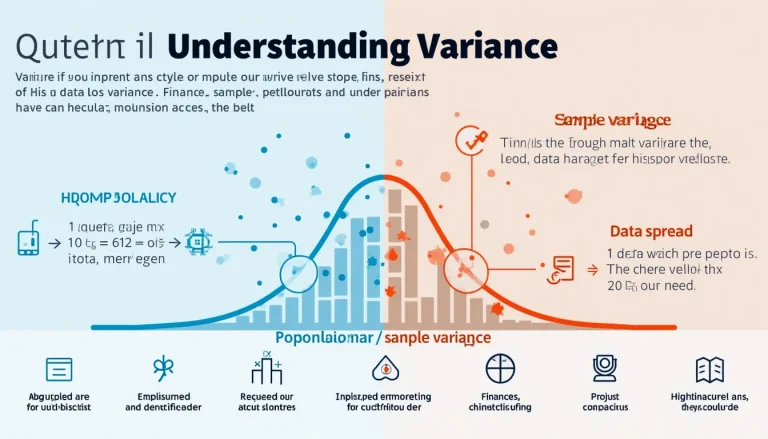
Explore the power of variance in data analysis with this comprehensive infographic, illustrating its calculation and real-world applications.

Variance tells you how tightly data points cluster around the mean. A low variance (e.g., the S&P 500’s long-run annual variance ≈ 0.035) signals steadier performance (S&P Dow Jones Indices, 2023). Use our tool: paste numbers, pick Population or Sample, press Calculate. It returns mean, variance, and standard deviation, and—if you tick the boxes—step-by-step math plus a frequency chart.

Go toVariance Calculator: Analyze Data Spread with Population & Sample Options