COGS Calculator
Is this tool helpful?
How to Use the COGS Calculator Effectively
Our Cost of Goods Sold (COGS) Calculator is designed to help businesses accurately determine their COGS and gross profit. Follow these steps to use the calculator effectively:
- Enter Beginning Inventory: Input the monetary value of your inventory at the start of the accounting period. For example, if you had $10,000 worth of inventory at the beginning of the month, enter “10000” in this field.
- Input Purchases during the Period: Enter the total cost of new inventory purchased during the accounting period. If you bought $5,000 worth of new inventory, input “5000” here.
- Provide Ending Inventory: Enter the value of your remaining inventory at the end of the accounting period. For instance, if you have $8,000 worth of inventory left, type “8000” in this field.
- Add Total Revenue (Optional): If you want to calculate your gross profit, enter your total revenue for the period. For example, if your total sales were $25,000, input “25000” in this field.
- Click “Calculate COGS”: After entering all the required information, click the “Calculate COGS” button to get your results.
The calculator will then display your Cost of Goods Sold (COGS) and, if you provided total revenue, your Gross Profit for the period.
Understanding Cost of Goods Sold (COGS) and Its Importance
Cost of Goods Sold (COGS) is a crucial financial metric that represents the direct costs associated with producing the goods sold by a company. It’s an essential component of a company’s income statement and plays a vital role in determining profitability.
The COGS Formula
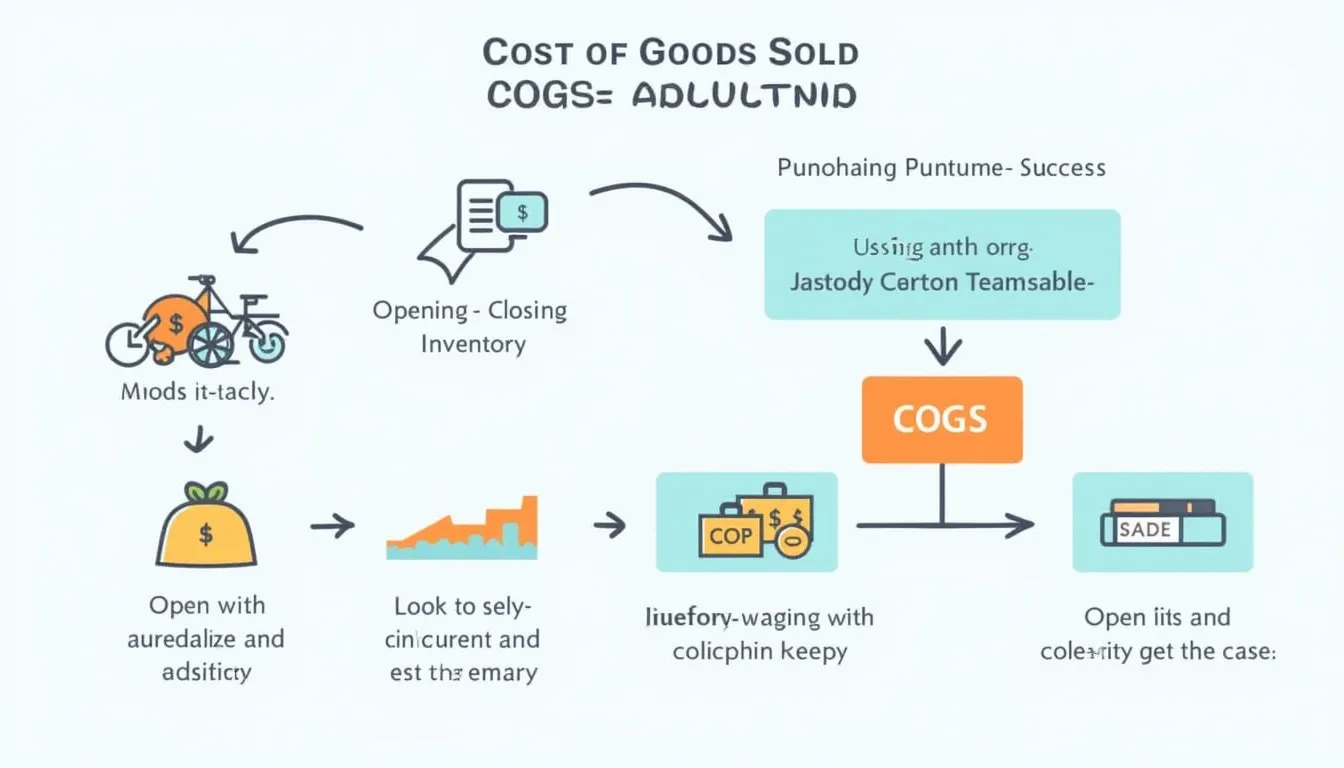
The formula for calculating COGS is:
$$COGS = Beginning\;Inventory + Purchases\;during\;the\;Period – Ending\;Inventory$$This formula helps businesses accurately track the cost of inventory sold during a specific period, which is crucial for financial reporting and decision-making.
Why COGS Matters
Understanding and accurately calculating COGS is vital for several reasons:
- It directly impacts gross profit and overall profitability
- It helps in determining appropriate pricing strategies
- It’s essential for tax reporting and compliance
- It provides insights into inventory management efficiency
- It aids in budgeting and financial forecasting
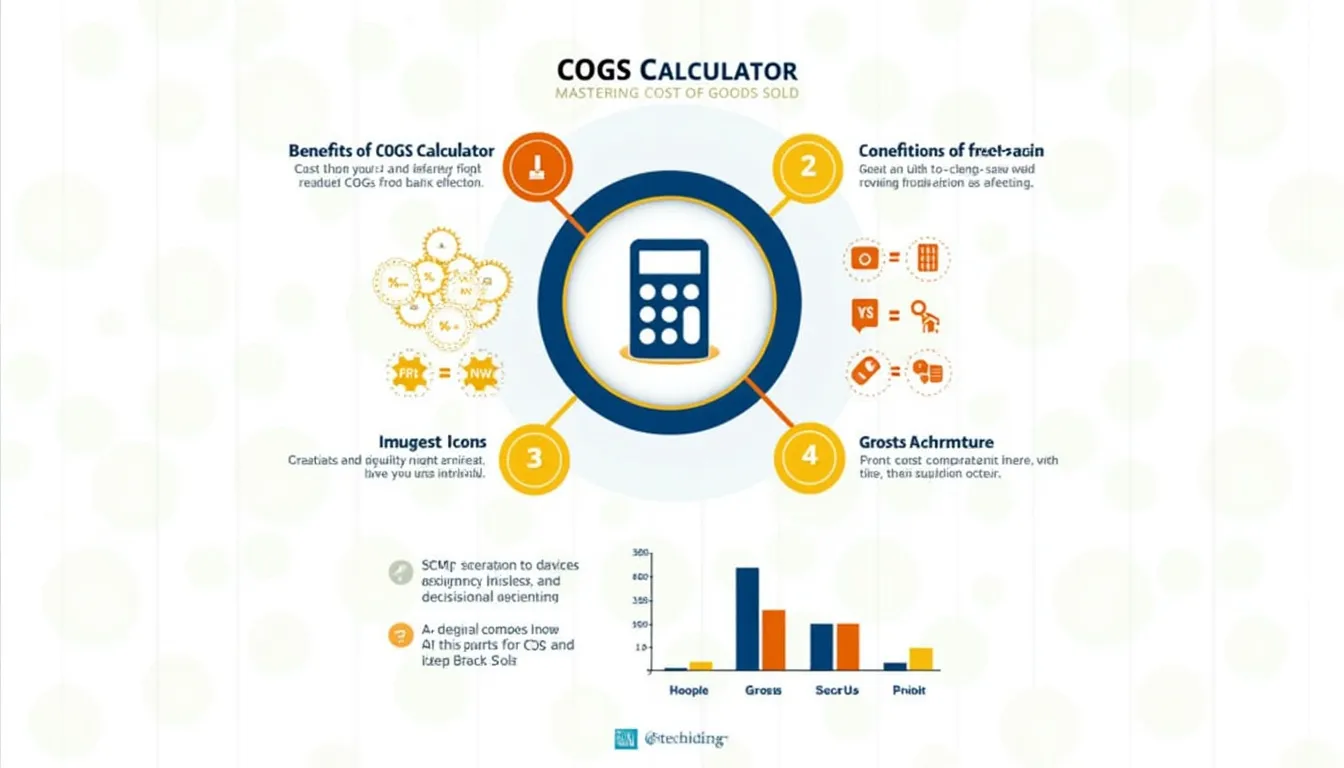
Benefits of Using the COGS Calculator
Our COGS Calculator offers numerous advantages for businesses of all sizes:
1. Accuracy and Consistency
By using a dedicated calculator, you ensure that your COGS calculations are accurate and consistent across all accounting periods. This reduces the risk of human error and provides reliable data for financial analysis.
2. Time-Saving
Manual COGS calculations can be time-consuming, especially for businesses with large inventories. Our calculator streamlines the process, allowing you to get results quickly and efficiently.
3. Easy Gross Profit Calculation
With the optional total revenue input, you can instantly calculate your gross profit alongside COGS. This provides a comprehensive view of your business’s financial performance at a glance.
4. Informed Decision-Making
By regularly using the COGS Calculator, you can track trends in your inventory costs and sales performance. This information is invaluable for making informed decisions about pricing, purchasing, and inventory management.
5. Financial Planning Support
Accurate COGS calculations are essential for budgeting and financial forecasting. Our calculator helps you establish a solid foundation for your financial planning efforts.
How the COGS Calculator Addresses User Needs
Our COGS Calculator is designed to address specific challenges faced by businesses when it comes to inventory management and financial reporting:
Simplifying Complex Calculations
For many business owners, especially those without a strong accounting background, calculating COGS can be daunting. Our calculator simplifies this process, making it accessible to users of all skill levels.
Providing Quick Insights
In today’s fast-paced business environment, quick access to financial data is crucial. The COGS Calculator delivers instant results, allowing you to make timely decisions based on up-to-date information.
Enhancing Financial Transparency
By clearly breaking down the components of COGS, our calculator promotes better understanding of your business’s cost structure. This transparency can lead to more effective cost management strategies.
Supporting Various Business Types
Whether you’re running a small retail shop or managing a large manufacturing operation, our COGS Calculator is versatile enough to meet your needs. It accommodates businesses of all sizes and across various industries.
Practical Applications and Examples
Let’s explore some real-world scenarios where the COGS Calculator proves invaluable:
Example 1: Retail Clothing Store
A clothing boutique wants to calculate its COGS for the past month. Here’s how they might use the calculator:
- Beginning Inventory: $50,000
- Purchases during the Period: $30,000
- Ending Inventory: $45,000
- Total Revenue: $80,000
After inputting these values, the calculator would show:
- COGS: $35,000
- Gross Profit: $45,000
This information helps the store owner understand that their cost of goods sold for the month was $35,000, and they made a gross profit of $45,000.
Example 2: Small Manufacturing Business
A furniture manufacturer wants to assess their COGS for the quarter:
- Beginning Inventory: $100,000
- Purchases during the Period: $150,000
- Ending Inventory: $120,000
- Total Revenue: $300,000
The calculator would provide:
- COGS: $130,000
- Gross Profit: $170,000
This shows that the manufacturer’s direct costs for the quarter were $130,000, resulting in a gross profit of $170,000.
Example 3: Seasonal Business Analysis
A beachwear company wants to compare its COGS between peak and off-peak seasons:
Peak Season:
- Beginning Inventory: $200,000
- Purchases during the Period: $300,000
- Ending Inventory: $150,000
- Total Revenue: $600,000
Results:
- COGS: $350,000
- Gross Profit: $250,000
Off-Peak Season:
- Beginning Inventory: $150,000
- Purchases during the Period: $100,000
- Ending Inventory: $180,000
- Total Revenue: $200,000
Results:
- COGS: $70,000
- Gross Profit: $130,000
By comparing these results, the company can better understand its seasonal cost structure and plan inventory purchases accordingly.
Advanced COGS Analysis Techniques
While our COGS Calculator provides essential information, advanced users can leverage this data for more in-depth analysis:
Gross Profit Margin Calculation
Use the COGS and Total Revenue figures to calculate your Gross Profit Margin:
$$Gross\;Profit\;Margin = \frac{(Total\;Revenue – COGS)}{Total\;Revenue} \times 100\%$$This percentage helps you understand how much of each dollar of revenue is kept as gross profit.
Inventory Turnover Ratio
Combine COGS with average inventory values to calculate your Inventory Turnover Ratio:
$$Inventory\;Turnover\;Ratio = \frac{COGS}{Average\;Inventory}$$Where Average Inventory = (Beginning Inventory + Ending Inventory) / 2
This ratio indicates how many times your inventory is sold and replaced over a period.
COGS to Sales Ratio
Calculate the COGS to Sales Ratio to assess cost efficiency:
$$COGS\;to\;Sales\;Ratio = \frac{COGS}{Total\;Revenue} \times 100\%$$A lower ratio generally indicates better cost management and higher profitability.
Integrating COGS Calculations into Business Strategy
Understanding your COGS is just the first step. Here’s how you can use this information to drive business growth:
Pricing Strategy Refinement
Use COGS data to ensure your pricing strategy allows for adequate profit margins. If COGS is increasing, you may need to adjust prices or find ways to reduce costs.
Inventory Management Optimization
Analyze COGS trends to optimize your inventory levels. High COGS might indicate overstocking, while consistently low ending inventory could suggest stockouts.
Supplier Negotiations
If your COGS is higher than industry averages, use this data to negotiate better terms with suppliers or explore alternative sourcing options.
Product Line Evaluation
Calculate COGS for individual product lines to identify which are most and least profitable. This can inform decisions about product mix and marketing focus.
Frequently Asked Questions (FAQ)
Q1: How often should I calculate my COGS?
A: It’s recommended to calculate COGS at least quarterly, but many businesses benefit from monthly calculations. Consistent tracking allows for better trend analysis and more responsive decision-making.
Q2: Can I use the COGS Calculator for service-based businesses?
A: While COGS is typically associated with goods-based businesses, service companies can adapt the concept to track direct costs associated with service delivery. In this case, “inventory” might represent unbilled services or work-in-progress.
Q3: How does COGS affect my tax calculations?
A: COGS is deducted from your total revenue when calculating taxable income. Accurate COGS calculations are crucial for ensuring you’re not overpaying on taxes while remaining compliant with tax regulations.
Q4: What if my Ending Inventory is higher than Beginning Inventory plus Purchases?
A: This situation could indicate inventory shrinkage, errors in inventory counting, or potential theft. It’s important to investigate any discrepancies to ensure accurate financial reporting.
Q5: How can I reduce my COGS?
A: Strategies to reduce COGS include negotiating better prices with suppliers, improving inventory management to reduce waste, optimizing production processes, and considering bulk purchasing when appropriate.
Q6: Is COGS the same as “Cost of Sales”?
A: While often used interchangeably, there can be slight differences. COGS typically refers to the direct costs of producing goods, while Cost of Sales might include additional costs related to sales, such as shipping or sales commissions.
Q7: How does COGS relate to break-even analysis?
A: COGS is a crucial component of break-even analysis. By understanding your COGS, you can more accurately determine the sales volume needed to cover all costs and start generating profit.
Conclusion: Empowering Financial Decision-Making with COGS
The Cost of Goods Sold (COGS) Calculator is more than just a tool for financial calculations; it’s a gateway to deeper understanding and control of your business’s financial health. By regularly using this calculator and analyzing the results, you can:
- Make data-driven decisions about pricing and inventory management
- Identify trends in your cost structure over time
- Improve your gross profit margins through informed strategies
- Enhance your financial reporting accuracy
- Better prepare for tax season and financial audits
Remember, while the COGS Calculator provides valuable insights, it’s most powerful when used as part of a comprehensive financial management strategy. Combine these calculations with other financial metrics, industry benchmarks, and your unique business knowledge to drive sustainable growth and profitability.
By mastering the use of the COGS Calculator and understanding its implications, you’re taking a significant step towards financial empowerment and business success. Keep tracking, keep analyzing, and let the numbers guide you towards smarter, more profitable business decisions.
Important Disclaimer
The calculations, results, and content provided by our tools are not guaranteed to be accurate, complete, or reliable. Users are responsible for verifying and interpreting the results. Our content and tools may contain errors, biases, or inconsistencies. We reserve the right to save inputs and outputs from our tools for the purposes of error debugging, bias identification, and performance improvement. External companies providing AI models used in our tools may also save and process data in accordance with their own policies. By using our tools, you consent to this data collection and processing. We reserve the right to limit the usage of our tools based on current usability factors. By using our tools, you acknowledge that you have read, understood, and agreed to this disclaimer. You accept the inherent risks and limitations associated with the use of our tools and services.


