Correlation Coefficient Calculator: Analyze Relationships Between Variables

Unlock the power of data analysis with our Correlation Coefficient Calculator. Discover how to quantify relationships between variables, visualize trends, and make informed decisions. From finance to scientific research, this tool simplifies complex calculations. Ready to explore hidden patterns in your data? Learn how to leverage correlation analysis today!

Correlation Calculator

Enter numeric values separated by commas

Enter numeric values separated by commas

Number of decimal places (0-10)

How to Use the Correlation Coefficient Calculator Effectively

Our Correlation Coefficient Calculator is a powerful tool designed to help you analyze the relationship between two sets of data. Follow these steps to use the calculator effectively:

  1. Enter Data Set X: In the first text area, input your X values separated by commas. For example: 1, 2, 3, 4, 5
  2. Enter Data Set Y: In the second text area, input your Y values separated by commas. For example: 2, 4, 6, 8, 10
  3. Set Decimal Precision: (Optional) Adjust the number of decimal places for the result using the provided input field. The default is 4 decimal places.
  4. Calculate: Click the “Calculate Correlation” button to process your data.
  5. Review Results: The calculator will display the correlation coefficient, interpretation, and a scatter plot visualization.

Understanding Correlation Coefficient: Definition, Purpose, and Benefits

The correlation coefficient is a statistical measure that quantifies the strength and direction of the linear relationship between two variables. It’s an essential tool in various fields, including statistics, data science, economics, and social sciences.

Definition and Purpose

The Pearson correlation coefficient, denoted as ‘r’, measures the linear correlation between two sets of data. It ranges from -1 to +1, where:

  • +1 indicates a perfect positive linear correlation
  • 0 indicates no linear correlation
  • -1 indicates a perfect negative linear correlation

The purpose of calculating the correlation coefficient is to understand how changes in one variable are associated with changes in another variable. This information is crucial for making predictions, identifying trends, and understanding relationships in various datasets.

Benefits of Using the Correlation Coefficient Calculator

  • Quick and Accurate Results: Our calculator performs complex calculations instantly, saving you time and reducing the risk of manual errors.
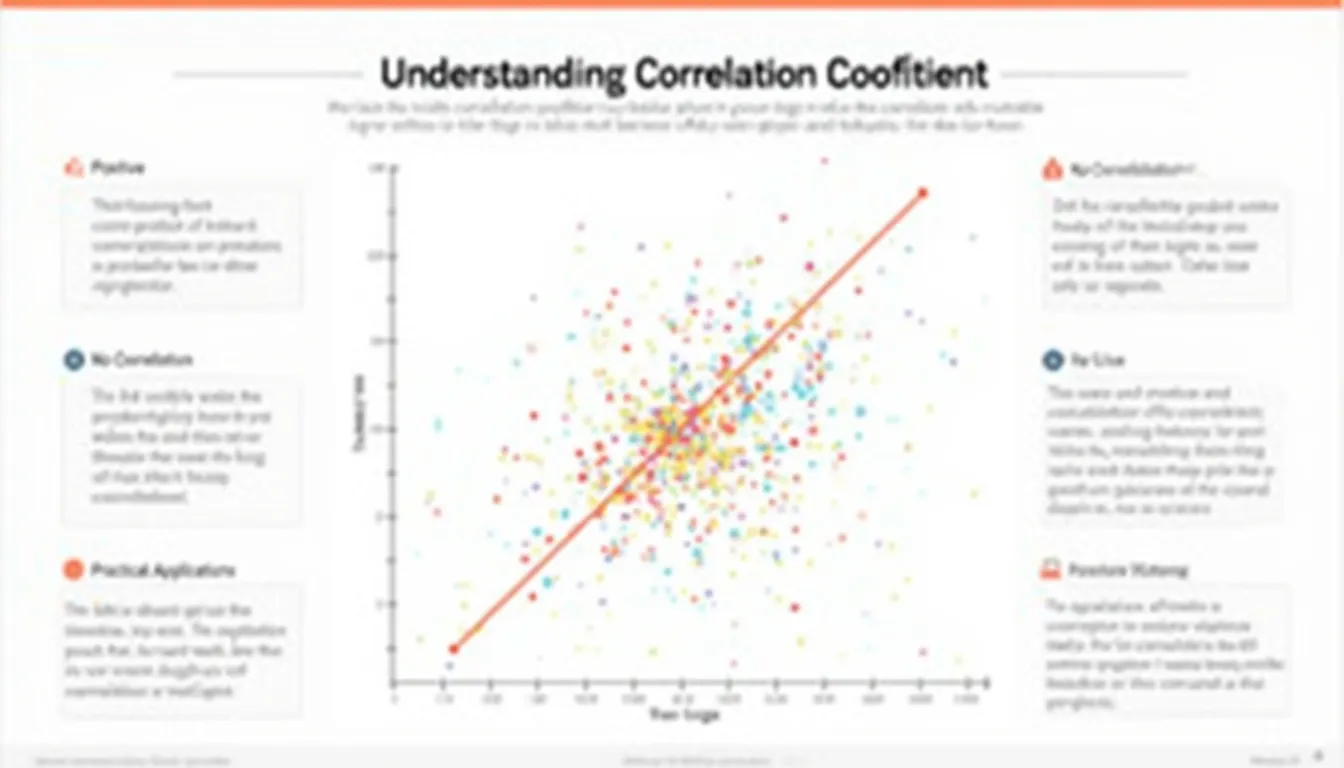
  • Visual Representation: The included scatter plot helps you visualize the relationship between variables at a glance.
  • Interpretation Guidance: The tool provides a clear interpretation of the correlation strength, helping you understand the results even if you’re not a statistics expert.
  • Flexible Input Options: You can easily input your data using comma-separated values, making it convenient to copy and paste from spreadsheets or other data sources.
  • Customizable Precision: Adjust the decimal precision to match your specific needs or reporting requirements.

The Mathematics Behind Correlation Coefficient

The Pearson correlation coefficient is calculated using the following formula:

$$r = \frac{\sum_{i=1}^{n} (x_i – \bar{x})(y_i – \bar{y})}{\sqrt{\sum_{i=1}^{n} (x_i – \bar{x})^2 \sum_{i=1}^{n} (y_i – \bar{y})^2}}$$

Where:

  • r is the Pearson correlation coefficient
  • xi and yi are individual sample points
  • x̄ and ȳ are the means of the x and y datasets, respectively
  • n is the number of data points

Step-by-Step Calculation Process

  1. Calculate the mean of both datasets (x̄ and ȳ)
  2. For each data point, calculate (xi – x̄) and (yi – ȳ)
  3. Multiply these differences for each pair of points
  4. Sum all these products to get the numerator
  5. Square the differences calculated in step 2 for both x and y
  6. Sum the squared differences for x and y separately
  7. Multiply these sums and take the square root to get the denominator
  8. Divide the numerator by the denominator to get the correlation coefficient

Addressing User Needs and Solving Specific Problems

Our Correlation Coefficient Calculator addresses several key user needs and solves specific problems in data analysis:

1. Simplifying Complex Calculations

Manually calculating the correlation coefficient can be time-consuming and error-prone, especially for large datasets. Our calculator automates this process, allowing users to focus on interpreting results rather than performing tedious calculations.

2. Visualizing Data Relationships

The integrated scatter plot provides an immediate visual representation of the data, helping users quickly grasp the nature of the relationship between variables. This visual aid is particularly useful for presenting findings to non-technical audiences or for quickly identifying outliers or patterns in the data.

3. Interpreting Results

Understanding the meaning of a correlation coefficient value can be challenging for those not well-versed in statistics. Our calculator provides a clear interpretation of the result, helping users understand the strength and direction of the relationship without needing extensive statistical knowledge.

4. Facilitating Data-Driven Decision Making

By providing quick and accurate correlation analysis, our calculator empowers users to make data-driven decisions in various fields such as finance, marketing, scientific research, and more. It allows for rapid hypothesis testing and trend identification, which can be crucial in fast-paced business or research environments.

5. Enhancing Research and Analysis

For researchers and analysts, our tool streamlines the process of exploring relationships between variables. This can be particularly useful in the early stages of research when identifying potential correlations can guide further investigation or experimental design.

Practical Applications and Use Cases

The Correlation Coefficient Calculator has a wide range of practical applications across various fields. Here are some examples:

1. Finance and Economics

In financial analysis, correlation coefficients are used to assess relationships between different assets or economic indicators. For example:

  • Stock Market Analysis: An investor might use the calculator to determine the correlation between a stock’s price and a market index.
  • Economic Indicators: Economists could analyze the correlation between GDP growth and unemployment rates.
Example Calculation:

Let’s say we want to examine the correlation between a company’s advertising spend and its sales revenue over 10 months:

Advertising Spend (X): 100, 150, 200, 250, 300, 350, 400, 450, 500, 550
Sales Revenue (Y): 200, 250, 300, 350, 400, 500, 550, 600, 700, 750

Using our calculator, we find:

  • Correlation Coefficient (r): 0.9941
  • Interpretation: Very strong positive correlation

This suggests that as advertising spend increases, sales revenue tends to increase as well, with a very strong linear relationship.

2. Scientific Research

Scientists use correlation analysis to explore relationships between variables in their studies. For instance:

  • Environmental Science: Researchers might investigate the correlation between air pollution levels and respiratory disease rates in a city.
  • Psychology: A study could examine the correlation between hours of sleep and academic performance.
Example Calculation:

Consider a psychology study examining the relationship between hours of sleep per night and exam scores:

Hours of Sleep (X): 5, 6, 6.5, 7, 7.5, 8, 8.5, 9, 9.5, 10
Exam Scores (Y): 65, 70, 75, 80, 82, 85, 88, 90, 92, 91

Using our calculator, we find:

  • Correlation Coefficient (r): 0.9762
  • Interpretation: Very strong positive correlation

This indicates a strong positive relationship between hours of sleep and exam performance, suggesting that students who get more sleep tend to perform better on exams.

3. Marketing and Sales

Marketers and sales professionals use correlation analysis to understand customer behavior and optimize strategies:

  • Customer Behavior: Analyzing the correlation between customer engagement metrics and purchase frequency.
  • Pricing Strategy: Examining the relationship between price changes and sales volume.
Example Calculation:

A marketing team wants to understand the relationship between email open rates and click-through rates for their campaigns:

Email Open Rates (X): 20%, 25%, 30%, 35%, 40%, 45%, 50%, 55%, 60%, 65%
Click-Through Rates (Y): 2%, 3%, 3.5%, 4%, 5%, 5.5%, 6%, 7%, 7.5%, 8%

Using our calculator, we find:

  • Correlation Coefficient (r): 0.9945
  • Interpretation: Very strong positive correlation

This strong positive correlation suggests that as email open rates increase, click-through rates tend to increase as well, indicating that improving open rates could lead to higher engagement.

Frequently Asked Questions (FAQ)

Q1: What does a correlation coefficient of 0 mean?

A correlation coefficient of 0 indicates that there is no linear relationship between the two variables. However, it’s important to note that this doesn’t necessarily mean there’s no relationship at all – there could be a non-linear relationship that the Pearson correlation coefficient doesn’t capture.

Q2: Can the correlation coefficient be greater than 1 or less than -1?

No, the Pearson correlation coefficient is always between -1 and +1, inclusive. If you calculate a value outside this range, it typically indicates an error in the calculation.

Q3: How many data points do I need for a reliable correlation coefficient?

While you can calculate a correlation coefficient with as few as two data points, for more reliable results, it’s generally recommended to have at least 30 paired observations. However, the exact number can vary depending on the specific context and requirements of your analysis.

Q4: Does correlation imply causation?

No, correlation does not imply causation. A strong correlation between two variables doesn’t necessarily mean that one causes the other. There could be other factors influencing both variables, or the relationship could be coincidental.

Q5: Can I use this calculator for non-linear relationships?

The Pearson correlation coefficient is designed to measure linear relationships. For non-linear relationships, you might need to use other methods such as Spearman’s rank correlation or consider transforming your data before analysis.

Q6: How do I interpret a negative correlation coefficient?

A negative correlation coefficient indicates an inverse relationship between the variables. As one variable increases, the other tends to decrease. The strength of the negative correlation is interpreted the same way as positive correlations: values closer to -1 indicate stronger negative correlations.

Q7: Can I use this calculator for time series data?

While you can use this calculator for time series data, it’s important to be cautious about interpreting the results. Time series often have trends or seasonal patterns that can lead to spurious correlations. In many cases, it’s better to use specialized time series analysis techniques.

Q8: How does the scatter plot help in understanding correlation?

The scatter plot provides a visual representation of the relationship between the two variables. It allows you to see patterns, identify outliers, and get a sense of the direction and strength of the relationship. A linear trend in the scatter plot typically indicates a strong correlation, while a more scattered or random pattern suggests a weaker correlation.

Q9: What’s the difference between correlation and regression?

Correlation measures the strength and direction of a linear relationship between two variables, while regression goes a step further by modeling the relationship between a dependent variable and one or more independent variables. Regression allows you to make predictions based on the relationship, while correlation simply describes the association.

Q10: Can I use this calculator for categorical data?

The Pearson correlation coefficient is designed for continuous variables. For categorical data, you would need to use other methods such as chi-square tests for independence or Cramer’s V, depending on the nature of your categorical variables.

Conclusion

The Correlation Coefficient Calculator is a powerful tool for anyone working with data analysis, research, or decision-making based on quantitative information. By simplifying complex statistical calculations and providing clear, visual results, it enables users to quickly understand relationships between variables and make informed decisions.

Whether you’re a student learning about statistics, a researcher analyzing experimental data, a business analyst looking for market trends, or a data scientist exploring large datasets, this tool can significantly streamline your workflow and enhance your analytical capabilities.

Remember that while correlation is a valuable metric, it should always be interpreted in context and with an understanding of its limitations. Use this tool as part of a broader analytical approach, considering other factors and potential confounding variables in your analysis.

By leveraging the power of correlation analysis with our user-friendly calculator, you can uncover insights, test hypotheses, and drive data-informed decisions across a wide range of fields and applications. Start exploring your data relationships today and unlock the potential of correlation analysis in your work!

Important Disclaimer

The calculations, results, and content provided by our tools are not guaranteed to be accurate, complete, or reliable. Users are responsible for verifying and interpreting the results. Our content and tools may contain errors, biases, or inconsistencies. We reserve the right to save inputs and outputs from our tools for the purposes of error debugging, bias identification, and performance improvement. External companies providing AI models used in our tools may also save and process data in accordance with their own policies. By using our tools, you consent to this data collection and processing. We reserve the right to limit the usage of our tools based on current usability factors. By using our tools, you acknowledge that you have read, understood, and agreed to this disclaimer. You accept the inherent risks and limitations associated with the use of our tools and services.
Create Your Own Web Tool for Free