Customer Retention Analysis
Is this tool helpful?
How to use the tool
- Customer Data
Example A: “Current customers: 8,200; churn last quarter: 10 %; demographics: 70 % female, ages 18-34.”
Example B: “Subscribers: 60,000; monthly churn: 4 %; regions: 45 % Asia, 35 % Europe, 20 % Americas.” - Churn Reasons
Example A: “Delivery delays, limited payment methods, outdated mobile app.”
Example B: “Recent price hike, stronger competitor features, complex onboarding.” - Current Satisfaction Level
Example A: “5/10.”
Example B: “High (9/10).” - Industry Type
Example A: “Subscription Box Retail.”
Example B: “Online Language Learning.” - Submit & Review
Click Analyze and Generate Strategies. The report appears in seconds; copy it for planning or team sharing.
Quick-Facts
- Each 5 % retention gain boosts profits 25-95 % (Reichheld & Sasser, 1990).
- Average annual SaaS churn sits at 13 % (KBCM SaaS Survey 2022).
- Switching costs U.S. firms $1.6 trillion yearly (Accenture, 2018 Customer Survey).
- Acquiring a new customer costs 5-7× more than keeping one (Invesp, 2020).
- Poor onboarding drives 23 % of SaaS churn (ProfitWell Benchmarks 2021).
FAQ
What does the Customer Retention Strategy Analyzer do?
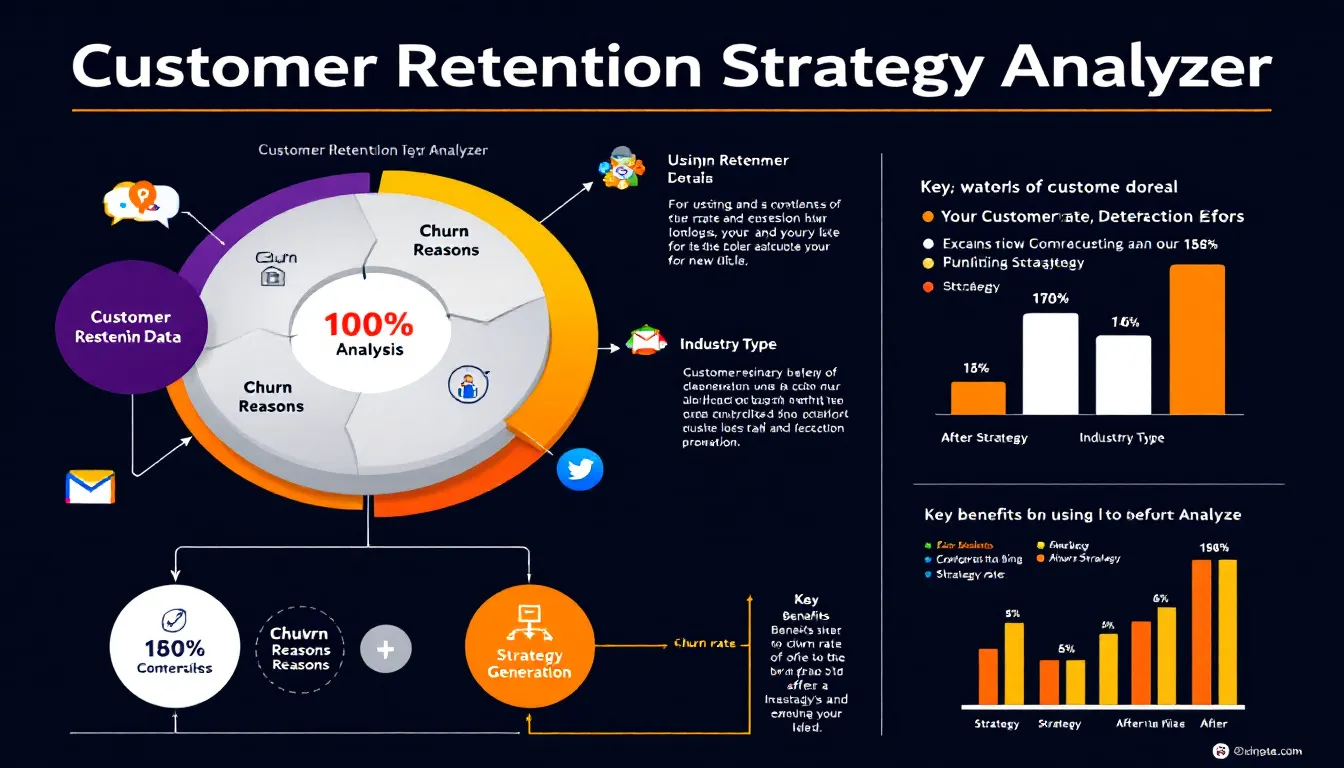
It converts your churn, satisfaction and industry data into a prioritized action list you can deploy today.
Which data should you collect before running it?
Prepare customer counts, churn percentages, major churn drivers and satisfaction scores for the most recent period (KBCM, 2022).
How long does one analysis take?
The cloud API returns strategies in under 30 seconds for typical datasets.
Can you assess multiple customer segments?
Yes—submit a separate form for each product line or segment to keep insights precise.
How often should you run the tool?
Quarterly checks catch shifting churn patterns; high-growth teams run it monthly (ProfitWell, 2021).
Does it work for both B2B and B2C?
Yes, recommendations adjust based on the industry type you enter, covering B2B and B2C contexts.
Which metrics will the report highlight?
You receive retention rate, projected Customer Lifetime Value and Net Promoter Score focus areas.
How do you export the results?
Click “Copy to Clipboard,” then paste into docs, emails or project boards—no file downloads needed.
Important Disclaimer
The calculations, results, and content provided by our tools are not guaranteed to be accurate, complete, or reliable. Users are responsible for verifying and interpreting the results. Our content and tools may contain errors, biases, or inconsistencies. Do not enter personal data, sensitive information, or personally identifiable information in our web forms or tools. Such data entry violates our terms of service and may result in unauthorized disclosure to third parties. We reserve the right to save inputs and outputs from our tools for the purposes of error debugging, bias identification, and performance improvement. External companies providing AI models used in our tools may also save and process data in accordance with their own policies. By using our tools, you consent to this data collection and processing. We reserve the right to limit the usage of our tools based on current usability factors.
