Debt to Equity Ratio Calculator: Analyze Financial Leverage Instantly

Unlock the power of financial analysis with our Debt to Equity Ratio Calculator. Assess company risk, make informed investments, and strategize business growth in seconds. From novice investors to seasoned analysts, this tool revolutionizes financial decision-making. Discover how to leverage this essential metric for success!

Debt to Equity Ratio Calculator

Enter the total liabilities of the company (e.g., 100000)

Enter the total equity of the company (e.g., 50000)

★ Add to Home Screen

Is this tool helpful?

Thanks for your feedback!

How to Use the Debt to Equity Ratio Calculator Effectively

Our Debt to Equity Ratio Calculator is a powerful tool designed to help investors, financial analysts, and business owners quickly assess a company’s financial leverage. Here’s a step-by-step guide on how to use this calculator effectively:

  1. Enter Total Liabilities: In the first input field, enter the company’s total liabilities. This figure should include all short-term and long-term debts, accounts payable, and other financial obligations.
  2. Input Total Equity: In the second field, enter the company’s total equity. This represents the shareholders’ stake in the company, including common stock, retained earnings, and additional paid-in capital.
  3. Click “Calculate”: Once you’ve entered both values, simply click the “Calculate” button.
  4. View Results: The calculator will instantly display the Debt to Equity Ratio, rounded to two decimal places for easy interpretation.

Remember, for accurate results, ensure that you’re using the most up-to-date financial data from reliable sources, such as the company’s balance sheet or annual report.

Understanding the Debt to Equity Ratio: Definition, Purpose, and Benefits

The Debt to Equity (D/E) Ratio is a fundamental financial metric that provides insights into a company’s capital structure and financial health. It’s calculated using the following formula:

$$ \text{Debt to Equity Ratio} = \frac{\text{Total Liabilities}}{\text{Total Equity}} $$

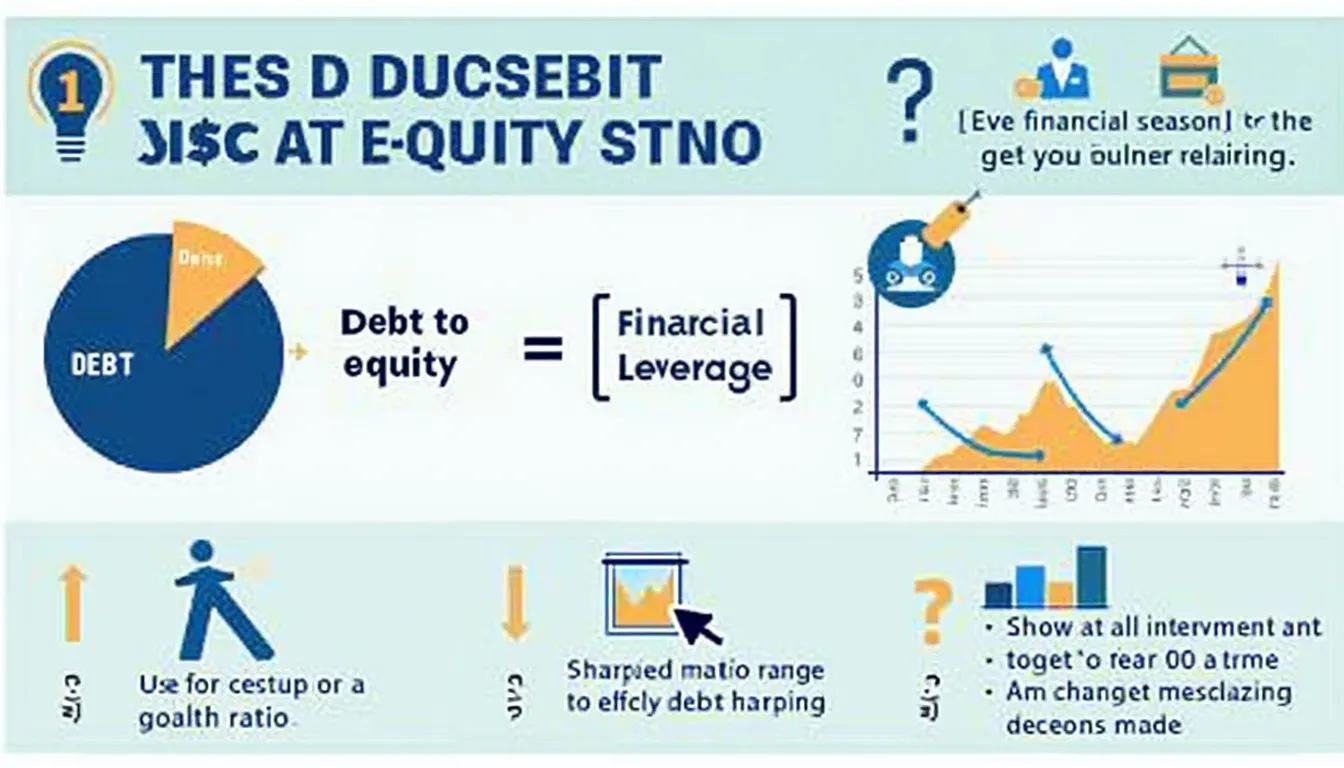
This ratio essentially compares a company’s total debt to its total equity, offering a snapshot of how much the company is financing its operations through debt versus shareholder investments.

Purpose of the Debt to Equity Ratio

The primary purpose of the D/E ratio is to assess a company’s financial leverage and risk profile. It helps stakeholders understand:

  • How much of the company’s assets are financed by debt versus equity
  • The company’s ability to cover its debts with available equity
  • The potential risk to shareholders if the company faces financial difficulties
  • The company’s financial strategy and its approach to growth and expansion

Benefits of Using the Debt to Equity Ratio Calculator

Our Debt to Equity Ratio Calculator offers several key benefits:

  1. Speed and Accuracy: Instantly calculate the D/E ratio without the risk of manual calculation errors.
  2. Consistency: Ensure uniform calculations across different companies or time periods for fair comparisons.
  3. Accessibility: Easily accessible online, allowing for quick financial analysis anytime, anywhere.
  4. User-Friendly: Simple interface suitable for both financial experts and novices.
  5. Decision Support: Provides a quick snapshot to support investment decisions or financial strategy planning.

How the Debt to Equity Ratio Calculator Addresses User Needs

Our calculator addresses several critical needs for various users in the financial sector:

For Investors

  • Risk Assessment: Quickly evaluate the financial risk associated with potential investments.
  • Comparative Analysis: Easily compare the financial leverage of multiple companies within an industry.
  • Portfolio Management: Regularly check the D/E ratios of companies in their portfolio to monitor risk levels.

For Financial Analysts

  • Efficient Analysis: Streamline the process of financial ratio calculation for multiple companies.
  • Trend Analysis: Quickly calculate D/E ratios over time to identify trends in a company’s financial strategy.
  • Report Generation: Easily incorporate accurate D/E ratios into financial reports and presentations.

For Business Owners and Managers

  • Financial Health Check: Regularly assess their company’s financial leverage position.
  • Strategic Planning: Use the D/E ratio to inform decisions about financing options for growth or expansion.
  • Benchmarking: Compare their company’s D/E ratio against industry standards or competitors.

For Students and Educators

  • Learning Tool: Provides a practical way to understand and apply financial ratio concepts.
  • Case Studies: Facilitates easy calculation of D/E ratios for various case studies and financial scenarios.

Practical Applications and Use Cases

The Debt to Equity Ratio Calculator has numerous practical applications across various scenarios. Let’s explore some real-world use cases:

1. Investment Decision Making

Imagine an investor considering two companies in the technology sector: TechCo A and TechCo B.

  • TechCo A: Total Liabilities = $500 million, Total Equity = $250 million
  • TechCo B: Total Liabilities = $300 million, Total Equity = $300 million

Using our calculator:

  • TechCo A’s D/E Ratio = 2.00
  • TechCo B’s D/E Ratio = 1.00

This quick analysis reveals that TechCo A is more leveraged, potentially indicating higher risk but also the possibility of higher returns. TechCo B, with its lower D/E ratio, might be considered more financially stable but potentially with lower growth prospects. The investor can use this information as part of their broader analysis to make an informed investment decision.

2. Loan Application Assessment

A small manufacturing company is applying for a bank loan to expand its operations. The company’s financial data shows:

  • Total Liabilities = $5 million
  • Total Equity = $4 million

Using our calculator, the D/E Ratio = 1.25

The bank’s loan officer can quickly assess that the company’s D/E ratio is 1.25, which might be considered acceptable depending on industry standards. This ratio helps the officer understand the company’s current debt levels and its capacity to take on additional debt, informing the decision on whether to approve the loan and under what terms.

3. Corporate Financial Strategy

A growing e-commerce company is deciding between two expansion strategies:

  1. Issue new shares to raise $10 million (increasing equity)
  2. Take on a $10 million loan (increasing debt)

Current financials: Total Liabilities = $30 million, Total Equity = $20 million

Using our calculator:

  • Current D/E Ratio = 1.50
  • After equity issuance: D/E Ratio = 1.00
  • After taking loan: D/E Ratio = 2.00

This analysis helps the company’s management visualize how each strategy would impact their financial leverage, aiding in making an informed decision that aligns with their risk tolerance and growth objectives.

4. Industry Comparison

A financial analyst is comparing the financial health of three major airlines:

  • Airline X: Total Liabilities = $20 billion, Total Equity = $10 billion
  • Airline Y: Total Liabilities = $15 billion, Total Equity = $12 billion
  • Airline Z: Total Liabilities = $18 billion, Total Equity = $9 billion

Using our calculator:

  • Airline X D/E Ratio = 2.00
  • Airline Y D/E Ratio = 1.25
  • Airline Z D/E Ratio = 2.00

This quick calculation allows the analyst to see that Airline Y has the lowest D/E ratio, potentially indicating a more conservative financial strategy or better financial health compared to its peers. This information can be crucial for industry analysis, stock recommendations, or credit rating assessments.

Frequently Asked Questions (FAQ)

Q1: What is a good Debt to Equity Ratio?

A: There’s no universally “good” D/E ratio as it varies by industry. Generally, a D/E ratio below 1.0 is considered relatively safe, while ratios above 2.0 may indicate higher financial risk. However, capital-intensive industries like utilities or manufacturing often have higher ratios. It’s essential to compare a company’s ratio to industry averages for context.

Q2: Can the Debt to Equity Ratio be negative?

A: Yes, a negative D/E ratio can occur when a company has negative equity, often due to accumulated losses exceeding its assets. This is generally considered a red flag, indicating severe financial distress.

Q3: How often should I calculate the Debt to Equity Ratio?

A: For publicly traded companies, it’s common to calculate the D/E ratio quarterly when new financial statements are released. For private companies or personal use, annual or semi-annual calculations are often sufficient, unless significant changes in the financial structure occur.

Q4: Are there limitations to using the Debt to Equity Ratio?

A: Yes, while useful, the D/E ratio has limitations. It doesn’t account for the quality of debt, cash flow to service debt, or industry-specific factors. It’s also based on book values, which may not reflect current market values. Always use the D/E ratio in conjunction with other financial metrics for a comprehensive analysis.

Q5: How does the Debt to Equity Ratio differ from the Debt Ratio?

A: The Debt Ratio compares total liabilities to total assets (Debt Ratio = Total Liabilities / Total Assets), while the D/E Ratio compares total liabilities to shareholders’ equity. Both provide insights into a company’s financial leverage, but from slightly different perspectives.

Q6: Can I use this calculator for personal finance?

A: While primarily designed for business analysis, you can adapt the D/E ratio concept for personal finance. Replace “Total Liabilities” with your total debts and “Total Equity” with your net worth (assets minus liabilities) to get a personal D/E ratio.

Q7: How does the Debt to Equity Ratio affect a company’s cost of capital?

A: Generally, a higher D/E ratio can lead to a higher cost of capital. As a company takes on more debt, lenders may perceive increased risk and demand higher interest rates. However, up to a certain point, debt can be cheaper than equity financing due to tax deductibility of interest payments.

Q8: Is a low Debt to Equity Ratio always better?

A: Not necessarily. While a low D/E ratio often indicates financial stability, it might also suggest that a company isn’t taking advantage of the potential benefits of leverage to fuel growth. The optimal D/E ratio depends on the company’s growth stage, industry, and overall financial strategy.

Disclaimer: While we strive for accuracy and reliability, we cannot guarantee that the webtool or results from our webtool are always correct, complete, or reliable. Our content and tools might have mistakes, biases, or inconsistencies. Users should use this calculator as a supplementary tool and not as a substitute for professional financial advice.

Conclusion: Leveraging the Power of the Debt to Equity Ratio Calculator

The Debt to Equity Ratio Calculator is an invaluable tool for anyone involved in financial analysis, investment decisions, or business management. By providing a quick and accurate calculation of this crucial financial metric, it empowers users to:

  • Assess financial risk and stability
  • Make informed investment decisions
  • Evaluate corporate financial strategies
  • Benchmark against industry standards
  • Monitor changes in financial leverage over time

In today’s fast-paced financial world, having instant access to accurate financial ratios can provide a significant advantage. Whether you’re an investor scrutinizing potential opportunities, a financial analyst preparing comprehensive reports, or a business owner planning your company’s financial future, our Debt to Equity Ratio Calculator offers the speed, accuracy, and reliability you need.

We encourage you to bookmark this tool and make it a regular part of your financial analysis toolkit. Remember, while the D/E ratio is a powerful indicator, it should always be used in conjunction with other financial metrics and qualitative factors for a holistic understanding of a company’s financial health.

Start using our Debt to Equity Ratio Calculator today and take the first step towards more informed, data-driven financial decisions. Your journey to better financial analysis and decision-making begins here!

Important Disclaimer

The calculations, results, and content provided by our tools are not guaranteed to be accurate, complete, or reliable. Users are responsible for verifying and interpreting the results. Our content and tools may contain errors, biases, or inconsistencies. We reserve the right to save inputs and outputs from our tools for the purposes of error debugging, bias identification, and performance improvement. External companies providing AI models used in our tools may also save and process data in accordance with their own policies. By using our tools, you consent to this data collection and processing. We reserve the right to limit the usage of our tools based on current usability factors. By using our tools, you acknowledge that you have read, understood, and agreed to this disclaimer. You accept the inherent risks and limitations associated with the use of our tools and services.
Create Your Own Web Tool for Free