Dividend Cover Calculator
Is this tool helpful?
How to use the tool
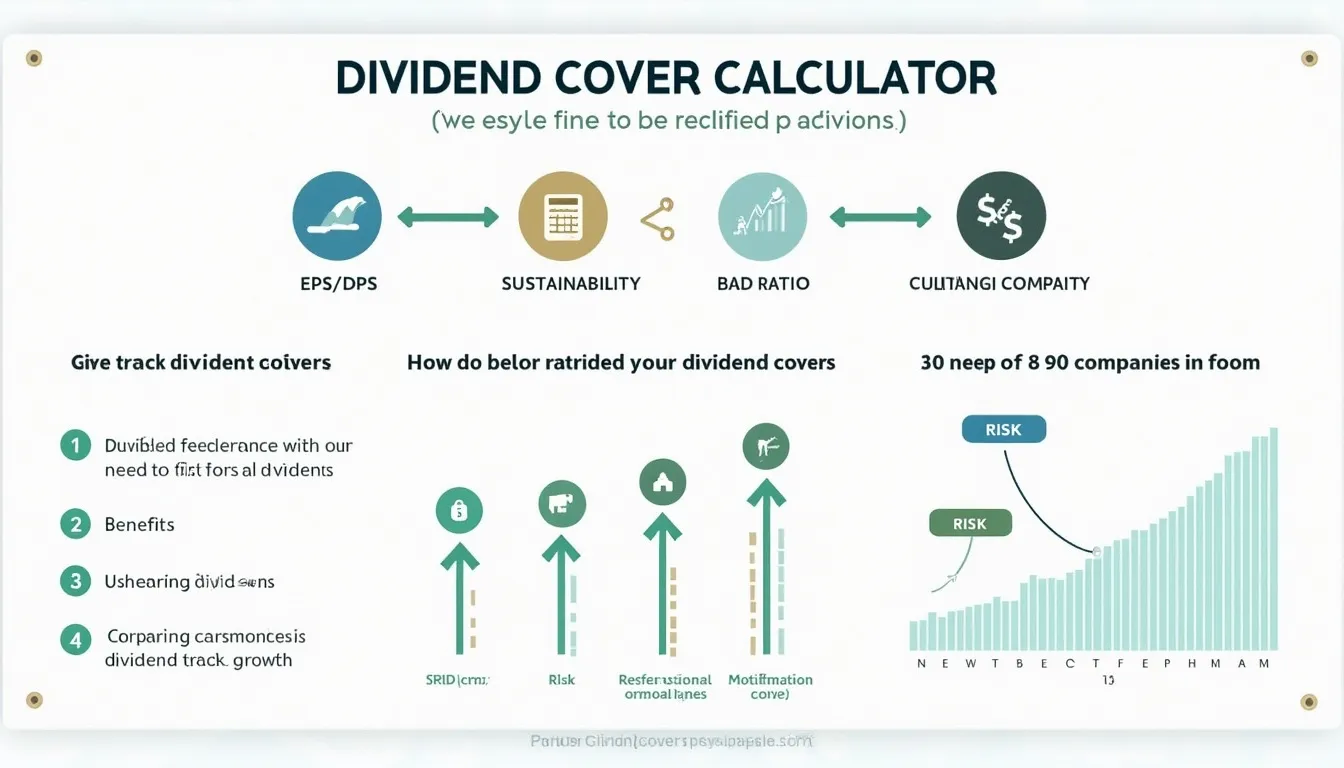
- Enter Earnings Per Share (EPS): Type the company’s EPS, e.g., 8.40 or 5.75.
- Enter Dividends Per Share (DPS): Add the DPS figure, e.g., 2.10 or 3.25.
- Press “Calculate”: The calculator divides EPS by DPS and shows the Dividend Cover ratio instantly.
- Interpret the result: A value above 2 signals ample coverage; below 1 signals danger.
Formula
$$\text{Dividend Cover}= rac{\text{EPS}}{\text{DPS}}$$
Example 1 — solid buffer
- EPS = 8.40
- DPS = 2.10
- Dividend Cover = 8.40 ÷ 2.10 = 4.00
Example 2 — potential risk
- EPS = 2.80
- DPS = 3.50
- Dividend Cover = 2.80 ÷ 3.50 = 0.80
Quick-Facts
- A Dividend Cover above 2.0 is viewed as safe (Dividend Coverage Ratio — Investopedia, https://www.investopedia.com/terms/d/dividendcoverageratio.asp).
- The median cover for U.S. utilities is 1.5 (Edison Electric Institute Q4 2023 Report, https://www.eei.org).
- Companies cut dividends 34 % more when cover falls below 1.2 (S&P Global Dividend Report 2023, https://www.spglobal.com).
- Benjamin Graham popularised the EPS/DPS test in “Security Analysis” (1934).
FAQ
What is dividend cover?
Dividend cover shows how many times current earnings can pay current dividends, guiding payout sustainability (Dividend Coverage Ratio — Investopedia, https://www.investopedia.com/terms/d/dividendcoverageratio.asp).
How does the calculator work?
You input EPS and DPS; the script divides the two values to output the ratio in real time.
Which ratio indicates a safe dividend?
Most analysts prefer ratios above 2 because earnings double the payout obligation (Morningstar Guide 2022, https://www.morningstar.com).
What if the ratio is below 1?
The company pays more in dividends than it earns; cuts or funding from debt become likely (S&P Global Dividend Report 2023, https://www.spglobal.com).
How often should you recalculate?
Recheck every quarter when new financial statements release to track payout safety (SEC Filing Calendar, https://www.sec.gov).
Does negative EPS ruin the ratio?
Yes. Negative EPS makes the ratio negative, signalling dividends funded from cash reserves or debt, a red flag (CFI Accounting Handbook 2023, https://corporatefinanceinstitute.com).
How does dividend cover differ from payout ratio?
Payout ratio equals DPS ÷ EPS, while dividend cover is its inverse; both express the same relationship differently.
Where can you find EPS and DPS numbers?
Use annual reports, Form 10-K filings, or financial data platforms such as EDGAR or Yahoo Finance.
Important Disclaimer
The calculations, results, and content provided by our tools are not guaranteed to be accurate, complete, or reliable. Users are responsible for verifying and interpreting the results. Our content and tools may contain errors, biases, or inconsistencies. Do not enter personal data, sensitive information, or personally identifiable information in our web forms or tools. Such data entry violates our terms of service and may result in unauthorized disclosure to third parties. We reserve the right to save inputs and outputs from our tools for the purposes of error debugging, bias identification, and performance improvement. External companies providing AI models used in our tools may also save and process data in accordance with their own policies. By using our tools, you consent to this data collection and processing. We reserve the right to limit the usage of our tools based on current usability factors.


