Dividend Payout Ratio Calculator
Is this tool helpful?
Dividend Payout Ratio Calculator: Evaluate Your Investment’s Profitability
How to Use the Dividend Payout Ratio Calculator Effectively
Our Dividend Payout Ratio Calculator is designed to help investors and financial analysts quickly determine the percentage of earnings a company distributes to its shareholders in the form of dividends. Follow these simple steps to use the calculator effectively:
- Enter the Dividend Per Share (DPS) in USD in the first input field.
- Input the Earnings Per Share (EPS) in USD in the second field.
- Click the “Calculate” button to generate the result.
- View the calculated Dividend Payout Ratio, along with the input values, in the results section.
The calculator will display the Dividend Payout Ratio as a percentage, allowing you to quickly assess the proportion of earnings being paid out as dividends.
Understanding the Dividend Payout Ratio: Definition, Purpose, and Benefits
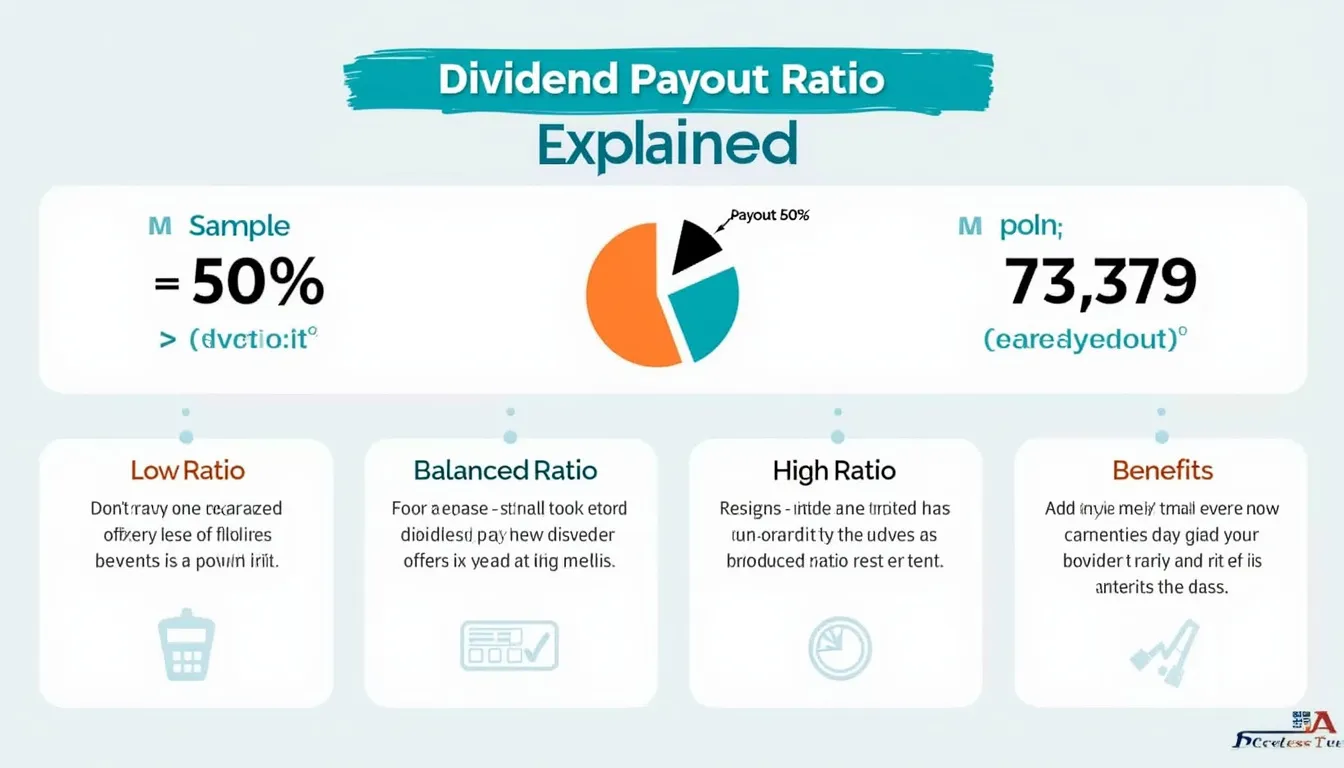
The Dividend Payout Ratio is a crucial financial metric that indicates the percentage of a company’s earnings distributed to shareholders as dividends. This ratio provides valuable insights into a company’s dividend policy and financial health, helping investors make informed decisions about potential investments.
Definition
The Dividend Payout Ratio is calculated by dividing the dividends per share by the earnings per share and expressing the result as a percentage. The formula is as follows:
$$ \text{Dividend Payout Ratio} = \frac{\text{Dividend Per Share (DPS)}}{\text{Earnings Per Share (EPS)}} \times 100\% $$Purpose
The primary purpose of calculating the Dividend Payout Ratio is to assess a company’s dividend policy and its ability to sustain dividend payments. This ratio helps investors understand:
- How much of the company’s earnings are being returned to shareholders
- The company’s strategy for balancing dividend payments with reinvestment in growth
- The sustainability of the current dividend level
- Potential for future dividend growth
Benefits
Understanding and utilizing the Dividend Payout Ratio offers several benefits to investors and financial analysts:
- Assessing dividend sustainability
- Comparing dividend policies across different companies or industries
- Identifying potential red flags in a company’s financial health
- Evaluating a company’s growth prospects
- Making informed investment decisions based on income potential
Benefits of Using the Dividend Payout Ratio Calculator
Our Dividend Payout Ratio Calculator offers numerous advantages for investors, financial analysts, and anyone interested in evaluating a company’s dividend policy:
- Time-saving: Quickly calculate the ratio without manual computations or complex spreadsheets.
- Accuracy: Eliminate human error in calculations, ensuring precise results every time.
- User-friendly interface: Easy-to-use design makes it accessible for both novice and experienced investors.
- Instant results: Get immediate feedback on a company’s dividend payout policy.
- Comparative analysis: Easily compare ratios for different companies or time periods.
- Investment decision support: Use the results to inform your investment strategies and portfolio management.
- Educational tool: Learn about dividend policies and their implications for company financials.
- Mobile-friendly: Access the calculator on-the-go from any device with an internet connection.
Addressing User Needs and Solving Specific Problems
The Dividend Payout Ratio Calculator addresses several key needs for investors and financial analysts:
1. Evaluating Dividend Sustainability
One of the primary concerns for income-focused investors is the sustainability of a company’s dividend payments. The Dividend Payout Ratio Calculator helps address this by providing a clear picture of how much of a company’s earnings are being paid out as dividends.
For example, if a company has a Dividend Payout Ratio of 75%, it means that 75% of its earnings are being distributed as dividends. While this might seem attractive to income-seeking investors, it could also indicate that the company has limited room for dividend growth or may struggle to maintain its dividend in case of a downturn.
2. Assessing Company Growth Prospects
The Dividend Payout Ratio also provides insights into a company’s growth strategy. A lower ratio might indicate that the company is reinvesting more of its earnings back into the business, potentially for future growth. Conversely, a higher ratio might suggest limited reinvestment and growth opportunities.
For instance, a technology company with a Dividend Payout Ratio of 20% might be allocating a significant portion of its earnings towards research and development or expansion, indicating potential for future growth.
3. Comparing Companies Within an Industry
The calculator allows investors to quickly compare the dividend policies of different companies within the same industry. This comparison can reveal valuable insights about each company’s financial strategy and market position.
For example, if Company A has a Dividend Payout Ratio of 60% while Company B has a ratio of 40%, it might indicate that Company A is more focused on returning value to shareholders through dividends, while Company B may be prioritizing reinvestment for growth.
4. Identifying Potential Red Flags
An unusually high Dividend Payout Ratio can be a red flag, potentially indicating that a company is paying out more in dividends than it can sustainably afford. The calculator helps investors quickly identify such situations.
For instance, if a company has a Dividend Payout Ratio exceeding 100%, it means it’s paying out more in dividends than it’s earning, which is unsustainable in the long term and may lead to dividend cuts or increased debt.
Practical Applications and Use Cases
The Dividend Payout Ratio Calculator has numerous practical applications across various scenarios in investment analysis and financial planning:
1. Income-Focused Investment Strategy
For investors prioritizing regular income from their investments, the Dividend Payout Ratio is a crucial metric. Let’s consider an example:
Suppose you’re analyzing two utility companies:
- Company A: DPS = $2.50, EPS = $5.00
- Company B: DPS = $3.00, EPS = $4.00
Using our calculator, you’d find:
- Company A’s Dividend Payout Ratio: 50%
- Company B’s Dividend Payout Ratio: 75%
While Company B offers a higher dividend, its higher payout ratio might indicate less room for dividend growth or increased risk of a dividend cut during economic downturns. Company A, with its lower payout ratio, might offer more sustainable dividends with potential for future increases.
2. Growth Stock Analysis
When evaluating growth stocks, a low Dividend Payout Ratio can be a positive sign, indicating that the company is reinvesting a significant portion of its earnings back into the business. Consider this example:
You’re analyzing two technology companies:
- Tech Co. A: DPS = $0.50, EPS = $5.00
- Tech Co. B: DPS = $2.00, EPS = $4.00
Using the calculator, you’d find:
- Tech Co. A’s Dividend Payout Ratio: 10%
- Tech Co. B’s Dividend Payout Ratio: 50%
Tech Co. A’s lower payout ratio suggests it’s reinvesting 90% of its earnings back into the business, potentially fueling future growth. This might be more attractive for investors seeking capital appreciation rather than immediate income.
3. Dividend Sustainability Assessment
The Dividend Payout Ratio is crucial for assessing the sustainability of a company’s dividend. Let’s look at an example:
Consider a company with the following financials over three years:
- Year 1: DPS = $1.00, EPS = $2.00
- Year 2: DPS = $1.20, EPS = $2.10
- Year 3: DPS = $1.50, EPS = $1.80
Using our calculator for each year:
- Year 1 Dividend Payout Ratio: 50%
- Year 2 Dividend Payout Ratio: 57.14%
- Year 3 Dividend Payout Ratio: 83.33%
The increasing payout ratio, especially the jump in Year 3, might raise concerns about the sustainability of future dividend increases or even the current dividend level if earnings don’t improve.
4. Industry Comparison
The Dividend Payout Ratio can vary significantly across industries. Using our calculator to compare companies within the same sector can provide valuable insights. For example, let’s compare three companies in the consumer goods sector:
- Company X: DPS = $2.00, EPS = $4.00
- Company Y: DPS = $1.50, EPS = $3.50
- Company Z: DPS = $1.80, EPS = $3.00
Calculating the Dividend Payout Ratios:
- Company X: 50%
- Company Y: 42.86%
- Company Z: 60%
This comparison allows investors to understand each company’s dividend policy relative to its peers, potentially indicating differences in growth strategies, financial health, or market positioning within the industry.
Frequently Asked Questions (FAQ)
1. What is a good Dividend Payout Ratio?
There’s no one-size-fits-all answer, as “good” ratios can vary by industry and company growth stage. Generally, a ratio between 30% and 50% is considered healthy, balancing shareholder returns with reinvestment for growth. However, some mature companies in stable industries might maintain higher ratios, while growth-focused companies might have lower ratios.
2. Can the Dividend Payout Ratio exceed 100%?
Yes, it’s possible, but it’s usually a red flag. A ratio over 100% means the company is paying out more in dividends than it’s earning, which is unsustainable in the long term. This situation might occur during temporary earnings dips, but persistent ratios over 100% often lead to dividend cuts.
3. How often should I calculate the Dividend Payout Ratio?
It’s advisable to calculate the ratio quarterly or at least annually, coinciding with the company’s financial reporting. Regular calculations help track changes in the company’s dividend policy and financial health over time.
4. What if a company has a very low Dividend Payout Ratio?
A very low ratio (e.g., below 20%) might indicate that the company is reinvesting most of its earnings for growth. This can be positive for growth-focused investors but might be less attractive for income-seeking investors. It could also suggest that the company is building cash reserves or paying down debt.
5. How does the Dividend Payout Ratio relate to dividend yield?
While both metrics involve dividends, they provide different insights. The Dividend Payout Ratio shows how much of earnings are paid as dividends, while dividend yield relates the dividend to the stock price. A high yield with a sustainable payout ratio can be attractive, but a high yield with a very high payout ratio might indicate risk.
6. Can companies with no earnings pay dividends?
Yes, companies can pay dividends even without earnings, but this results in a negative Dividend Payout Ratio. This situation is unsustainable long-term and often occurs when companies want to maintain a dividend despite temporary losses or are using cash reserves or debt to fund dividends.
7. How accurate is this calculator?
While we strive for accuracy, it’s important to note that we can’t guarantee that the webtool or results from our webtool are always correct, complete, or reliable. Our content and tools might have mistakes, biases, or inconsistencies. Always cross-reference with other sources and consult with financial professionals for important decisions.
Conclusion: Harnessing the Power of the Dividend Payout Ratio Calculator
The Dividend Payout Ratio Calculator is an invaluable tool for investors and financial analysts seeking to evaluate a company’s dividend policy and financial health. By providing quick and accurate calculations, this tool empowers users to make informed investment decisions, assess dividend sustainability, and compare companies within industries.
Key benefits of using our Dividend Payout Ratio Calculator include:
- Time-saving and error-free calculations
- Insights into dividend sustainability and company growth prospects
- Ability to compare dividend policies across different companies
- Identification of potential red flags in a company’s financial strategy
- Support for both income-focused and growth-oriented investment strategies
Whether you’re a seasoned investor or just starting your financial journey, the Dividend Payout Ratio Calculator offers valuable insights to enhance your investment analysis toolkit. By understanding and utilizing this crucial financial metric, you can make more informed decisions about potential investments and better align your portfolio with your financial goals.
We encourage you to bookmark this page and make the Dividend Payout Ratio Calculator a regular part of your investment research process. Remember, while this tool provides valuable insights, it should be used in conjunction with other financial metrics and thorough company analysis for comprehensive investment decision-making.
Start using our Dividend Payout Ratio Calculator today and take your investment analysis to the next level!
Important Disclaimer
The calculations, results, and content provided by our tools are not guaranteed to be accurate, complete, or reliable. Users are responsible for verifying and interpreting the results. Our content and tools may contain errors, biases, or inconsistencies. We reserve the right to save inputs and outputs from our tools for the purposes of error debugging, bias identification, and performance improvement. External companies providing AI models used in our tools may also save and process data in accordance with their own policies. By using our tools, you consent to this data collection and processing. We reserve the right to limit the usage of our tools based on current usability factors. By using our tools, you acknowledge that you have read, understood, and agreed to this disclaimer. You accept the inherent risks and limitations associated with the use of our tools and services.
