Dividend Yield Calculator
Is this tool helpful?
How to Use the Dividend Yield Calculator Effectively
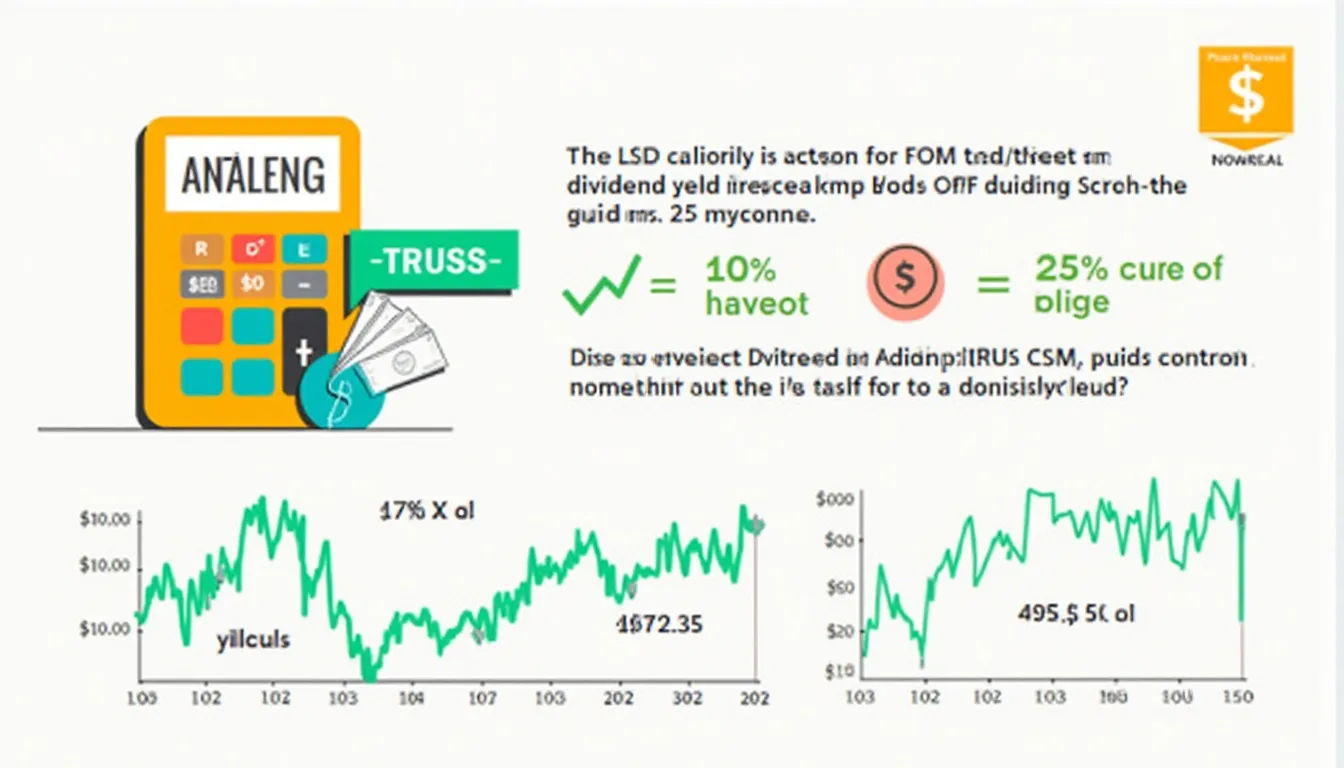
Our Dividend Yield Calculator is a powerful tool designed to help investors quickly and accurately determine the dividend yield of a stock. Here’s a step-by-step guide on how to use it effectively:
- Enter Dividends for the Period: In the first input field, enter the total amount of dividends paid by the company during the period you’re analyzing. This could be quarterly, semi-annually, or annually, depending on the company’s dividend policy.
- Input Initial Stock Price: In the second field, enter the stock’s price at the beginning of the period you’re analyzing. This is typically the stock’s price at the start of the year or the beginning of the dividend payment period.
- Click “Calculate”: Once you’ve entered both values, click the “Calculate” button to generate your result.
- Review the Result: The calculator will display the dividend yield as a percentage, rounded to two decimal places for precision.
Remember, for the most accurate results, ensure you’re using consistent time periods for both the dividends and the stock price. For example, if you’re calculating the annual dividend yield, use the total dividends paid over the year and the stock price at the beginning of that year.
Understanding Dividend Yield: A Crucial Metric for Income Investors
Dividend yield is a financial ratio that shows how much a company pays out in dividends each year relative to its stock price. It’s expressed as a percentage and calculated using the following formula:
$$ \text{Dividend Yield} = \frac{\text{Dividends for the Period}}{\text{Initial Price for the Period}} \times 100\% $$This metric is particularly important for income-focused investors as it provides a quick way to estimate the return on investment from dividends alone. A higher dividend yield typically indicates that a company is paying out a larger portion of its earnings or value to shareholders in the form of dividends.
The Benefits of Using Our Dividend Yield Calculator
Our Dividend Yield Calculator offers several advantages to investors and financial analysts:
- Time-Saving: Quickly compute dividend yields without the need for manual calculations or complex spreadsheets.
- Accuracy: Eliminate human error and ensure precise results every time.
- User-Friendly Interface: Easy-to-use design suitable for both novice and experienced investors.
- Instant Results: Get immediate feedback to inform your investment decisions.
- Comparison Tool: Easily compare dividend yields across different stocks or time periods.
- Educational Resource: Helps users understand the relationship between dividends and stock prices.
Addressing User Needs: How Our Calculator Solves Specific Problems
Our Dividend Yield Calculator addresses several key challenges faced by investors:
1. Simplifying Complex Calculations
For many investors, especially those new to dividend investing, calculating dividend yield manually can be daunting. Our calculator simplifies this process, allowing users to input just two values and receive an accurate result instantly.
2. Facilitating Investment Comparisons
When evaluating multiple dividend-paying stocks, it’s crucial to compare their yields. Our calculator allows investors to quickly calculate and compare yields across different stocks, helping them make more informed investment decisions.
3. Tracking Yield Changes Over Time
As stock prices fluctuate and companies adjust their dividend payments, yields can change significantly. Our calculator makes it easy to recalculate yields as these factors change, helping investors stay up-to-date on their investments’ performance.
4. Assessing Income Potential
For income-focused investors, understanding the potential return from dividends is crucial. Our calculator provides a clear picture of a stock’s income-generating potential, helping investors align their portfolios with their financial goals.
Practical Applications: Real-World Examples of Dividend Yield Calculation
Let’s explore some practical examples to illustrate how our Dividend Yield Calculator can be used in real-world scenarios:
Example 1: Evaluating a Blue-Chip Stock
Suppose you’re considering investing in a well-established company like Procter & Gamble (PG). In 2022, PG paid total dividends of $3.65 per share. If the stock price at the beginning of the year was $150, you could use our calculator as follows:
- Dividends for the Period: $3.65
- Initial Price for the Period: $150
The calculator would return a dividend yield of 2.43%. This information helps you assess whether PG’s dividend yield aligns with your investment goals and how it compares to other potential investments.
Example 2: Analyzing a High-Yield Stock
Consider a real estate investment trust (REIT) like Realty Income Corporation (O), known for its high dividend yield. If Realty Income paid total dividends of $2.96 per share in 2022 and the stock price at the beginning of the year was $70, you would input:
- Dividends for the Period: $2.96
- Initial Price for the Period: $70
The calculator would show a dividend yield of 4.23%. This higher yield reflects the REIT’s focus on generating income for shareholders, but it’s important to consider other factors like growth potential and risk when evaluating such investments.
Example 3: Comparing Stocks in the Same Sector
Let’s say you’re comparing two technology companies: Microsoft (MSFT) and Apple (AAPL). In 2022:
Microsoft:
- Dividends for the Period: $2.48
- Initial Price for the Period: $330
Apple:
- Dividends for the Period: $0.92
- Initial Price for the Period: $180
By using our calculator for both stocks, you can quickly see that Microsoft offered a higher dividend yield in this scenario. However, remember that dividend yield is just one factor to consider when evaluating stocks, and it’s important to look at other metrics and the companies’ overall financial health as well.
Frequently Asked Questions (FAQ)
1. What is a good dividend yield?
There’s no universally “good” dividend yield, as it depends on various factors including the sector, company growth stage, and overall market conditions. Generally, a yield between 2% to 6% is considered attractive, but higher yields may indicate higher risk.
2. How often should I recalculate dividend yield?
It’s a good practice to recalculate dividend yield annually or whenever there’s a significant change in the stock price or dividend policy. Regular recalculation helps you stay informed about your investment’s current income potential.
3. Can dividend yield be negative?
No, dividend yield cannot be negative. If a company doesn’t pay dividends, the yield would be 0%. However, if a company suspends its dividend, the forward dividend yield could potentially be 0% even if it paid dividends in the past.
4. Is a higher dividend yield always better?
Not necessarily. While a higher yield may seem attractive, it could also indicate potential risks. For example, if a stock’s price falls dramatically, the yield will increase, but this could signal underlying problems with the company.
5. How does dividend yield differ from dividend payout ratio?
Dividend yield measures the dividend relative to the stock price, while the dividend payout ratio measures dividends relative to the company’s earnings. Both metrics are important for evaluating a company’s dividend policy.
6. Can I use this calculator for ETFs or mutual funds?
Yes, you can use this calculator for ETFs or mutual funds that pay dividends. Simply use the total dividends paid by the fund over the period and the fund’s price at the beginning of the period.
7. How does inflation affect dividend yield?
Inflation doesn’t directly affect the calculation of dividend yield. However, high inflation can erode the real value of dividend payments over time, making it important to consider the “real” yield after accounting for inflation.
8. Are dividends guaranteed?
No, dividends are not guaranteed. Companies can reduce, suspend, or eliminate their dividends at any time, especially during financial difficulties.
9. How does dividend yield relate to total return?
Dividend yield is one component of total return, which also includes capital appreciation (or depreciation) of the stock price. A stock with a high dividend yield but declining price might still have a negative total return.
10. Can this calculator be used for stocks from different countries?
Yes, as long as you use consistent currency units for both the dividends and stock price, you can use this calculator for stocks from any country.
Disclaimer: While we strive for accuracy, we cannot guarantee that our webtool or its results are always correct, complete, or reliable. Our content and tools may contain errors, biases, or inconsistencies. Always cross-check important financial calculations and consult with a qualified financial advisor for personalized advice.
Conclusion: Empowering Your Dividend Investment Strategy
Our Dividend Yield Calculator is a powerful tool designed to simplify and enhance your dividend investing strategy. By providing quick, accurate calculations of dividend yields, it enables you to:
- Easily compare different dividend-paying stocks
- Assess the income potential of your investments
- Make more informed decisions about your portfolio allocation
- Track changes in yield over time as stock prices and dividend policies evolve
Remember, while dividend yield is a crucial metric for income investors, it should be considered alongside other factors such as the company’s financial health, growth prospects, and overall market conditions. Our calculator serves as a valuable starting point for your investment research, providing you with key insights to help guide your decision-making process.
We encourage you to bookmark this page and make our Dividend Yield Calculator a regular part of your investment toolkit. Whether you’re a seasoned investor or just starting your journey in dividend investing, this tool can help you navigate the complexities of the stock market with greater confidence and precision.
Start calculating dividend yields today and take the first step towards optimizing your dividend investment strategy!
Important Disclaimer
The calculations, results, and content provided by our tools are not guaranteed to be accurate, complete, or reliable. Users are responsible for verifying and interpreting the results. Our content and tools may contain errors, biases, or inconsistencies. We reserve the right to save inputs and outputs from our tools for the purposes of error debugging, bias identification, and performance improvement. External companies providing AI models used in our tools may also save and process data in accordance with their own policies. By using our tools, you consent to this data collection and processing. We reserve the right to limit the usage of our tools based on current usability factors. By using our tools, you acknowledge that you have read, understood, and agreed to this disclaimer. You accept the inherent risks and limitations associated with the use of our tools and services.