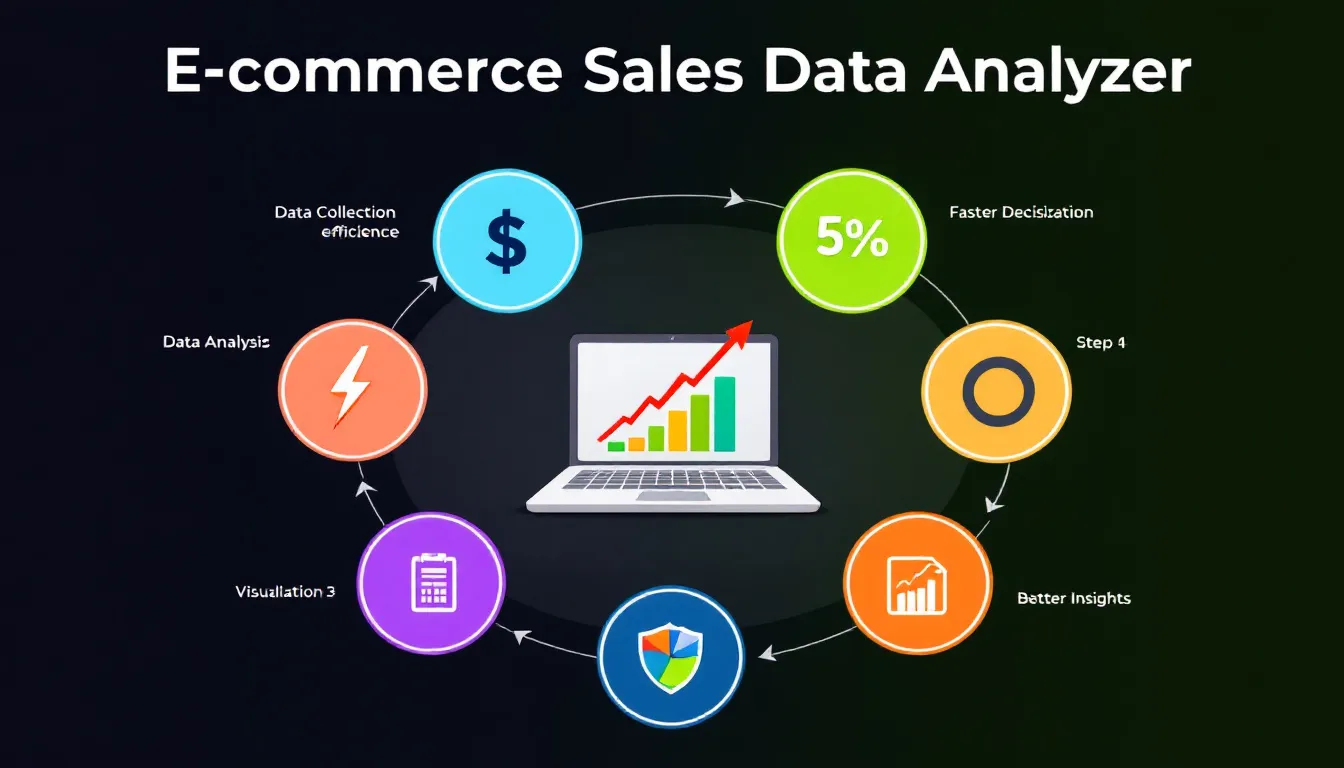
E-commerce Sales Data Analyzer: Boost Your Online Store Performance

Harness the power of data-driven decision-making with our E-commerce Sales Data Analyzer. This tool helps you identify key trends, optimize conversion rates, and gain valuable insights into customer behavior and product performance. Elevate your online store's success with actionable recommendations based on in-depth analysis.

E-commerce Sales Data Analysis

Include product IDs, quantities, prices, and dates for comprehensive analysis.

Specify the exact time frame for accurate trend analysis.

Enter specific KPIs you want to analyze, separated by commas (Optional).

List your main product categories, separated by commas (Optional).

Include relevant customer demographic information for targeted analysis (Optional).

★ Add to Home Screen

Is this tool helpful?

Thanks for your feedback!

How to Use the E-commerce Sales Data Analysis Tool Effectively

To make the most of our E-commerce Sales Data Analysis Tool, follow these steps:

  1. Enter Recent Sales Data: In the first field, input your e-commerce sales data. This should include detailed information such as product IDs, quantities sold, prices, and transaction dates. For example:
    • Product ID: 1234, Quantity: 50, Price: $29.99, Date: 2023-05-01
    • Product ID: 5678, Quantity: 25, Price: $49.99, Date: 2023-05-02
  2. Specify Time Frame: Enter the time period for your analysis. This could be “Last 60 days” or “Q2 2023 (April 1 – June 30, 2023)”.
  3. Key Metrics (Optional): If you want to focus on specific KPIs, enter them here. For instance: “customer acquisition cost, repeat purchase rate, average order value”.
  4. Product Categories (Optional): List your main product categories. For example: “Smartphones, Laptops, Accessories”.
  5. Analyze Data: Click the “Analyze Sales Data” button to process your information.
  6. Review Results: Examine the detailed analysis provided in the results section.
  7. Copy Results: Use the “Copy to Clipboard” button to easily save or share your analysis.

Unlocking E-commerce Success: Your Ultimate Sales Data Analysis Tool

In the fast-paced world of e-commerce, data is king. Our E-commerce Sales Data Analysis Tool is your key to unlocking valuable insights from your sales data, empowering you to make informed decisions and drive your business forward. This powerful tool is designed to help e-commerce businesses of all sizes analyze their sales data, identify trends, and uncover opportunities for growth.

What is the E-commerce Sales Data Analysis Tool?

Our E-commerce Sales Data Analysis Tool is a sophisticated yet user-friendly platform that takes your raw sales data and transforms it into actionable insights. By leveraging advanced statistical analysis and data visualization techniques, this tool provides a comprehensive overview of your e-commerce performance, focusing on key metrics such as conversion rates, customer demographics, and product performance.

The Purpose of Data-Driven E-commerce Analysis

The primary purpose of this tool is to empower e-commerce businesses with data-driven decision-making capabilities. By analyzing historical sales data, businesses can:

  • Identify trends and patterns in customer behavior
  • Evaluate the performance of different products or categories
  • Understand the effectiveness of marketing campaigns
  • Optimize pricing strategies
  • Forecast future sales and inventory needs
  • Improve customer retention and lifetime value

Benefits of Using the E-commerce Sales Data Analysis Tool

Incorporating our analysis tool into your e-commerce strategy offers numerous benefits:

  1. Time Efficiency: Instead of spending hours manually crunching numbers, get instant insights with a few clicks.
  2. Accuracy: Minimize human error and ensure reliable results through automated data processing.
  3. Comprehensive Analysis: Gain a holistic view of your e-commerce performance across multiple dimensions.
  4. Data Visualization: Understand complex data through clear, visually appealing charts and graphs.
  5. Customization: Focus on the metrics that matter most to your business with optional input fields.
  6. Actionable Insights: Receive practical recommendations to improve your sales strategies.
  7. Competitive Advantage: Stay ahead of the curve by leveraging data-driven insights in your decision-making process.

Harnessing the Power of Data: How Our Tool Addresses E-commerce Challenges

E-commerce businesses face numerous challenges in today’s competitive landscape. Our E-commerce Sales Data Analysis Tool is specifically designed to address these pain points and provide solutions through data-driven insights.

Challenge 1: Understanding Customer Behavior

One of the most significant challenges for e-commerce businesses is understanding and predicting customer behavior. Our tool tackles this by analyzing patterns in your sales data, such as:

  • Purchase frequency
  • Average order value
  • Product preferences
  • Seasonal trends

By inputting your sales data and specifying the time frame, you can gain valuable insights into customer behavior. For example, if you enter data for the last 12 months, the tool might reveal that your average order value increases by 30% during the holiday season, or that customers who purchase product A are 50% more likely to return within 60 days to purchase product B.

Challenge 2: Optimizing Product Performance

Another common challenge is determining which products are driving revenue and which might be underperforming. Our tool addresses this by providing detailed product performance analysis, including:

  • Top-selling products
  • Products with the highest profit margins
  • Slow-moving inventory
  • Product category performance

For instance, if you input your product categories (e.g., “Electronics, Clothing, Home Decor”) along with your sales data, the tool might reveal that while Electronics has the highest total revenue, Home Decor has the highest profit margin and fastest growth rate.

Challenge 3: Improving Conversion Rates

Conversion rate optimization is crucial for e-commerce success. Our tool helps address this challenge by analyzing factors that influence conversions, such as:

  • Traffic sources with the highest conversion rates
  • Impact of pricing on conversion rates
  • Effectiveness of promotional campaigns
  • Seasonal fluctuations in conversion rates

By specifying “conversion rate” as one of your key metrics, you can receive tailored insights. The tool might uncover that your conversion rate from social media traffic is 2.5 times higher than from search engines, suggesting an opportunity to reallocate your marketing budget.

Challenge 4: Forecasting and Inventory Management

Accurate forecasting and efficient inventory management are critical for e-commerce businesses. Our tool helps address these challenges by:

  • Identifying sales trends and seasonality
  • Predicting future demand for products
  • Highlighting potential stockouts or overstock situations
  • Analyzing the relationship between inventory levels and sales performance

For example, if you input sales data for the past two years, the tool might predict a 40% increase in demand for a specific product category in the upcoming quarter, allowing you to adjust your inventory accordingly.

Practical Applications: Real-World Examples of E-commerce Data Analysis

To illustrate the practical value of our E-commerce Sales Data Analysis Tool, let’s explore some real-world scenarios where data-driven insights can make a significant impact.

Case Study 1: Seasonal Product Optimization

An online clothing retailer noticed fluctuating sales throughout the year but couldn’t pinpoint the exact patterns. By using our tool to analyze their sales data over the past 24 months, they discovered:

  • Sales of swimwear peaked 6-8 weeks before summer
  • Winter coat sales started rising as early as September
  • Accessories had consistent sales year-round, with a 50% spike during holiday seasons

Armed with these insights, the retailer adjusted their inventory management and marketing strategies. They launched targeted email campaigns for swimwear in early spring and began promoting winter coats in late summer. As a result, they saw a 25% increase in seasonal product sales and a 15% reduction in overstock inventory.

Case Study 2: Customer Segmentation and Personalization

A multi-category e-commerce store wanted to improve their customer retention rates. Using our tool to analyze their customer purchase history, they uncovered several distinct customer segments:

  • High-value customers who made large purchases but infrequently
  • Regular shoppers with moderate purchase values but high frequency
  • Seasonal shoppers who only bought during major sales events
  • One-time purchasers who never returned

Based on these insights, the store developed personalized marketing strategies for each segment. They created a loyalty program for regular shoppers, sent exclusive early-access invitations to high-value customers for new product launches, and crafted re-engagement campaigns for one-time purchasers. These targeted approaches resulted in a 30% increase in customer retention and a 20% boost in average customer lifetime value.

Case Study 3: Product Bundle Optimization

An electronics retailer wanted to increase their average order value through product bundling but wasn’t sure which combinations would be most effective. By analyzing their sales data with our tool, they discovered:

  • Customers who bought smartphones were 70% more likely to purchase a case within the same transaction
  • Laptop purchases were frequently followed by external hard drive purchases within 30 days
  • Customers who bought gaming consoles often added an extra controller and a popular game to their cart

Using these insights, the retailer created strategic product bundles: smartphone + case packages, laptop + external hard drive deals, and gaming console + extra controller + game bundles. They also implemented cross-sell recommendations based on these findings. As a result, their average order value increased by 35%, and customer satisfaction scores improved due to the convenience of these bundles.

Case Study 4: Pricing Strategy Optimization

A home decor e-commerce store was struggling with pricing their products competitively while maintaining profitability. They used our E-commerce Sales Data Analysis Tool to analyze their pricing data along with sales volumes. The analysis revealed:

  • Products priced ending in .99 had a 20% higher conversion rate than those with round number pricing
  • A 5% price decrease on slow-moving items resulted in a 50% increase in sales volume, leading to higher overall profits
  • Premium-priced items in certain categories (e.g., lighting fixtures) had unexpectedly high sales volumes, indicating an opportunity for a luxury product line

Based on these insights, the store adjusted their pricing strategy. They implemented .99 pricing across their product range, strategically reduced prices on slow-moving inventory, and introduced a new luxury product line. These changes led to a 15% increase in overall revenue and a 10% improvement in profit margins.

Frequently Asked Questions About E-commerce Sales Data Analysis

Q1: How often should I analyze my e-commerce sales data?

A1: The frequency of analysis can vary depending on your business needs, but generally, it’s recommended to perform a comprehensive analysis at least monthly. However, monitoring key metrics on a weekly or even daily basis can help you stay agile and responsive to market changes.

Q2: What are the most important KPIs for e-commerce businesses?

A2: While important KPIs can vary by business model, some universally crucial metrics include:

  • Conversion Rate
  • Average Order Value (AOV)
  • Customer Lifetime Value (CLV)
  • Cart Abandonment Rate
  • Customer Acquisition Cost (CAC)
  • Return on Ad Spend (ROAS)
  • Repeat Purchase Rate
Our tool allows you to focus on the KPIs most relevant to your business goals.

Q3: How can I use the insights from this tool to improve my marketing strategies?

A3: The insights from our tool can inform various aspects of your marketing strategy:

  • Use customer segmentation data to create targeted marketing campaigns
  • Adjust your ad spend based on the most effective traffic sources
  • Time your promotional campaigns according to identified seasonal trends
  • Tailor your email marketing content based on product affinity insights
  • Optimize your retargeting efforts using data on customer purchase patterns

Q4: Can this tool help with inventory management?

A4: Absolutely! Our tool provides valuable insights for inventory management by:

  • Identifying fast-moving and slow-moving products
  • Predicting seasonal demand fluctuations
  • Highlighting potential stockout risks
  • Analyzing the relationship between inventory levels and sales performance
These insights can help you optimize your inventory levels, reduce carrying costs, and minimize the risk of stockouts or overstocking.

Q5: How does this tool handle multi-channel sales data?

A5: Our E-commerce Sales Data Analysis Tool is designed to handle data from multiple sales channels. You can input data from various sources (e.g., your website, marketplaces, social media shops) into the tool. The analysis will provide insights both at an aggregate level and broken down by channel, allowing you to compare performance across different platforms.

Q6: Can this tool help me understand my customer lifetime value (CLV)?

A6: Yes, our tool can provide insights into customer lifetime value. By analyzing purchase frequency, average order value, and customer retention rates, the tool can help you estimate CLV. This information is crucial for making informed decisions about customer acquisition costs, loyalty programs, and long-term business strategies.

Q7: How can I use this tool to improve my product offerings?

A7: Our tool offers several ways to optimize your product offerings:

  • Identify top-performing products that you might want to expand or promote more heavily
  • Spot underperforming products that may need improvement or removal from your catalog
  • Discover complementary products often purchased together, which can inform bundle offerings or cross-sell strategies
  • Analyze seasonal trends to adjust your product mix throughout the year
  • Identify price points where products perform best, helping you optimize your pricing strategy

Q8: Can this tool help me understand and reduce cart abandonment?

A8: While our tool doesn’t directly track user behavior on your website, it can provide insights that help address cart abandonment. For example:

  • Identifying price points where conversions drop off, which might indicate price sensitivity
  • Analyzing the impact of shipping costs on conversion rates
  • Comparing conversion rates across different product categories or types
  • Evaluating the effectiveness of different promotional strategies in reducing abandonment
These insights can guide you in making changes to your checkout process, pricing, or offerings to reduce cart abandonment.

Q9: How can I use this tool to improve customer retention?

A9: Our tool provides several insights that can help improve customer retention:

  • Identify the average time between purchases, helping you time your re-engagement campaigns
  • Analyze which products are most likely to lead to repeat purchases
  • Understand the characteristics of your most loyal customers to inform loyalty programs
  • Identify at-risk customers based on changing purchase patterns
  • Evaluate the long-term impact of different acquisition channels on customer retention
Using these insights, you can develop targeted strategies to encourage repeat purchases and build customer loyalty.

Q10: Can this tool help me with competitive pricing?

A10: While our tool doesn’t directly collect competitor data, it can still provide valuable insights for competitive pricing:

  • Analyze the relationship between your pricing changes and sales volume
  • Identify price elasticity for different products or categories
  • Understand which price points drive the most revenue and profit
  • Evaluate the impact of promotional pricing on overall sales and customer behavior
These insights can help you make informed decisions about your pricing strategy in relation to your competitors.

Important Disclaimer

The calculations, results, and content provided by our tools are not guaranteed to be accurate, complete, or reliable. Users are responsible for verifying and interpreting the results. Our content and tools may contain errors, biases, or inconsistencies. We reserve the right to save inputs and outputs from our tools for the purposes of error debugging, bias identification, and performance improvement. External companies providing AI models used in our tools may also save and process data in accordance with their own policies. By using our tools, you consent to this data collection and processing. We reserve the right to limit the usage of our tools based on current usability factors. By using our tools, you acknowledge that you have read, understood, and agreed to this disclaimer. You accept the inherent risks and limitations associated with the use of our tools and services.
Create Your Own Web Tool for Free