Earnings Per Share (EPS) Calculator: Analyze Company Profitability

Unlock the power of financial analysis with our Earnings Per Share (EPS) Calculator. Discover how this essential tool can streamline your investment decisions, compare companies effortlessly, and track business performance over time. Learn to calculate EPS like a pro and gain valuable insights into company profitability. Ready to elevate your financial acumen? Explore now!

Earnings Per Share (EPS) Calculator

Enter the company's net income in dollars

Enter the number of weighted average outstanding shares

How to Use the EPS Calculator Effectively

Our Earnings Per Share (EPS) Calculator is a powerful tool designed to help investors, financial analysts, and business professionals quickly and accurately calculate a company’s EPS. Here’s a step-by-step guide on how to use this calculator effectively:

  1. Enter Net Income: Input the company’s net income in the first field. This figure can typically be found on a company’s income statement.
  2. Input Weighted Average Outstanding Shares: Enter the number of weighted average outstanding shares in the second field. This information is usually available in a company’s financial reports.
  3. Click “Calculate EPS”: Once you’ve entered both values, simply click the “Calculate EPS” button.
  4. View Results: The calculator will instantly display the Earnings Per Share (EPS) value, rounded to two decimal places.

Remember, accuracy is key when using financial calculators. Always ensure you’re using the most up-to-date and reliable financial data for your calculations.

Understanding Earnings Per Share: Definition, Purpose, and Benefits

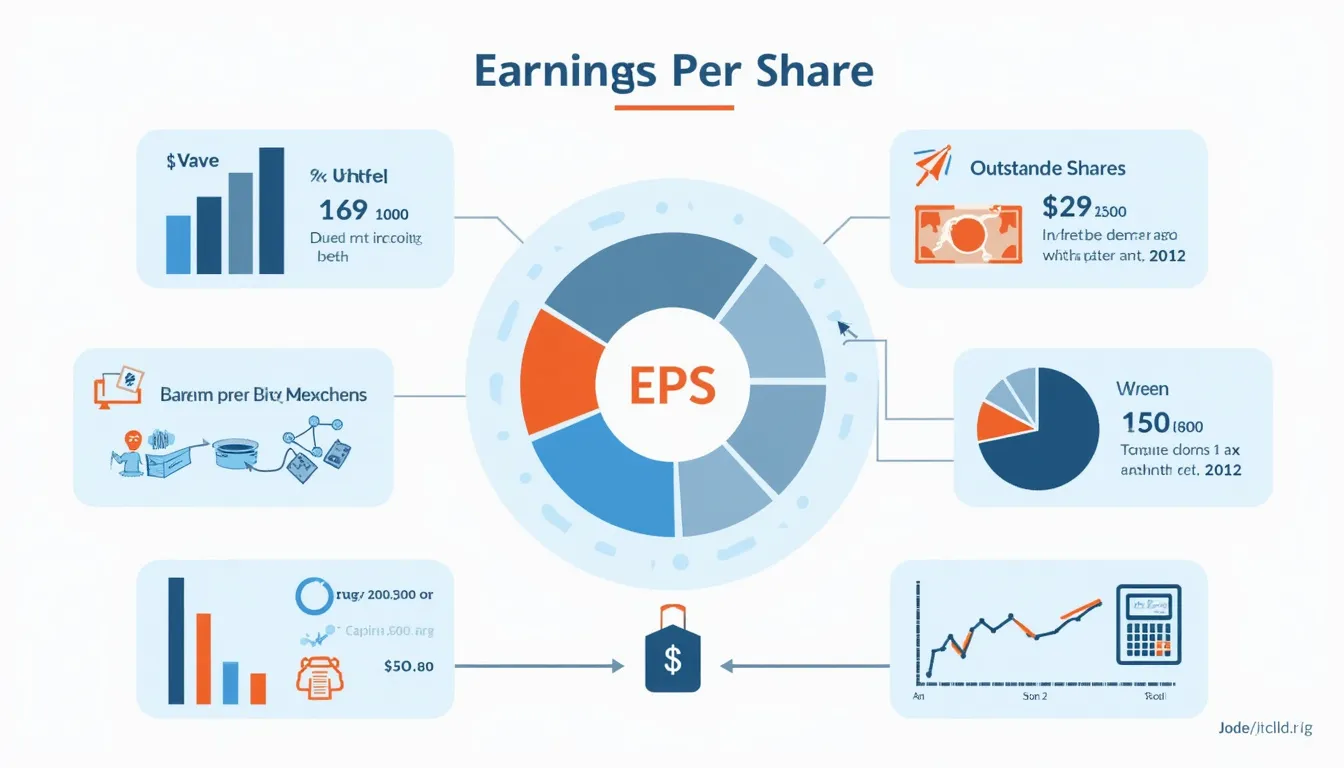
Earnings Per Share (EPS) is a crucial financial metric that measures a company’s profitability on a per-share basis. It’s calculated by dividing a company’s net income by its weighted average number of outstanding shares. The formula can be expressed as:

$$ EPS = \frac{Net Income}{Weighted Average Outstanding Shares} $$

EPS serves several important purposes in financial analysis:

  • It provides a standardized measure of profitability, allowing for easy comparison between companies of different sizes.
  • It helps investors assess a company’s financial health and potential for growth.
  • It’s a key component in calculating other important financial ratios, such as the price-to-earnings (P/E) ratio.
  • It’s often used as a benchmark for determining dividend payments and executive compensation.

The benefits of understanding and calculating EPS are numerous:

  • Informed Investment Decisions: EPS helps investors gauge a company’s profitability and make more informed investment choices.
  • Performance Tracking: By monitoring EPS over time, stakeholders can track a company’s financial performance and growth trajectory.
  • Comparative Analysis: EPS facilitates easy comparison between different companies within the same industry.
  • Valuation Insights: EPS is a key input in various valuation models, helping analysts determine a company’s fair value.

Benefits of Using the EPS Calculator

Our Earnings Per Share Calculator offers several advantages over manual calculations:

  1. Speed and Efficiency: Calculate EPS instantly, saving valuable time in financial analysis.
  2. Accuracy: Eliminate human error and ensure precise calculations every time.
  3. User-Friendly Interface: The intuitive design makes it easy for users of all skill levels to calculate EPS.
  4. Accessibility: Access the calculator anytime, anywhere, directly from your web browser.
  5. No Software Installation: Use the tool without the need to download or install any additional software.
  6. Real-Time Results: Get immediate results as you input or update your data.
  7. Educational Tool: Helps users understand the relationship between net income, outstanding shares, and EPS.

Addressing User Needs and Solving Specific Problems

Our EPS Calculator addresses several key user needs and solves specific problems in financial analysis:

1. Time-Saving Solution for Financial Professionals

Financial analysts and investment professionals often need to calculate EPS for multiple companies quickly. Manual calculations can be time-consuming and prone to errors. Our calculator streamlines this process, allowing for rapid, accurate EPS calculations, thus freeing up valuable time for more in-depth analysis.

2. Accessibility for Individual Investors

Individual investors may not have access to sophisticated financial software or the expertise to perform complex calculations. Our user-friendly EPS Calculator bridges this gap, empowering retail investors to make more informed decisions based on accurate EPS data.

3. Educational Tool for Finance Students

Finance and accounting students can use this calculator to reinforce their understanding of EPS calculations. By inputting different values and seeing the results in real-time, students can gain practical insights into how changes in net income or outstanding shares affect EPS.

4. Quick Comparison Tool for Company Analysis

When comparing multiple companies, analysts need to calculate and compare EPS quickly. Our calculator allows for rapid recalculation by simply changing the input values, facilitating efficient comparative analysis.

5. Accuracy in Financial Reporting

For businesses preparing financial reports, accurate EPS calculations are crucial. Our calculator ensures precision in these calculations, helping to maintain the integrity of financial statements and reports.

Practical Applications and Use Cases

To illustrate the practical applications of our EPS Calculator, let’s explore some real-world use cases:

Case Study 1: Comparative Analysis in the Tech Sector

Imagine an investor comparing two tech giants: Company A and Company B. Using our EPS Calculator, they input the following data:

  • Company A: Net Income = $20 billion, Outstanding Shares = 5 billion
  • Company B: Net Income = $15 billion, Outstanding Shares = 3 billion

The calculator quickly reveals:

  • Company A EPS: $4.00
  • Company B EPS: $5.00

Despite Company A having a higher net income, Company B shows a higher EPS, potentially indicating better efficiency in generating profit per share.

Case Study 2: Tracking Company Growth

A financial analyst is tracking the growth of a startup over three years. Using the EPS Calculator, they input the following data:

  • Year 1: Net Income = $1 million, Outstanding Shares = 1 million
  • Year 2: Net Income = $2.5 million, Outstanding Shares = 1.2 million
  • Year 3: Net Income = $5 million, Outstanding Shares = 1.5 million

The calculator shows:

  • Year 1 EPS: $1.00
  • Year 2 EPS: $2.08
  • Year 3 EPS: $3.33

This quick calculation reveals a steady increase in EPS, indicating strong growth and improving profitability per share.

Case Study 3: Assessing the Impact of Stock Buybacks

A company announces a stock buyback program, reducing its outstanding shares from 100 million to 90 million. Its net income remains constant at $500 million. Using the EPS Calculator:

  • Before buyback: Net Income = $500 million, Outstanding Shares = 100 million
  • After buyback: Net Income = $500 million, Outstanding Shares = 90 million

The calculator reveals:

  • EPS before buyback: $5.00
  • EPS after buyback: $5.56

This demonstrates how reducing the number of outstanding shares can increase EPS, potentially making the stock more attractive to investors.

Frequently Asked Questions (FAQ)

1. What is Earnings Per Share (EPS)?

Earnings Per Share (EPS) is a financial ratio that measures a company’s net profit on a per-share basis. It’s calculated by dividing a company’s net income by its weighted average number of outstanding shares.

2. Why is EPS important?

EPS is important because it provides insight into a company’s profitability on a per-share basis. It’s widely used by investors and analysts to assess a company’s financial health, compare companies within an industry, and make investment decisions.

3. How often should I calculate EPS?

EPS is typically calculated quarterly and annually, in line with companies’ financial reporting schedules. However, investors and analysts may calculate it more frequently when conducting in-depth financial analysis.

4. What’s the difference between basic EPS and diluted EPS?

Basic EPS uses only common shares in its calculation, while diluted EPS includes all convertible securities (like stock options and convertible preferred shares) that could potentially dilute earnings per share if converted.

5. Can EPS be negative?

Yes, EPS can be negative if a company reports a net loss instead of a net profit for the period in question.

6. How does stock splitting affect EPS?

A stock split doesn’t directly affect EPS because both the net income and the number of outstanding shares are adjusted proportionally. However, historical EPS figures are typically adjusted to reflect the split for accurate comparison.

7. Is a higher EPS always better?

While a higher EPS generally indicates better profitability, it’s important to consider other factors and ratios. A company might have a high EPS due to financial engineering (like stock buybacks) rather than improved operational performance.

8. How accurate is this EPS Calculator?

Our EPS Calculator uses the standard formula for basic EPS and provides results rounded to two decimal places. However, it’s important to note that we can’t guarantee that the webtool or results from our webtool are always correct, complete, or reliable. Our content and tools might have mistakes, biases, or inconsistencies.

Conclusion: Empowering Financial Analysis with the EPS Calculator

The Earnings Per Share (EPS) Calculator is an invaluable tool for anyone involved in financial analysis, investment decision-making, or business performance evaluation. By providing quick, accurate EPS calculations, it empowers users to:

  • Make more informed investment decisions
  • Conduct efficient comparative analysis of companies
  • Track company performance over time
  • Understand the impact of financial decisions on per-share profitability
  • Enhance financial literacy and understanding of key performance metrics

Whether you’re a seasoned financial analyst, an individual investor, or a student of finance, our EPS Calculator offers a user-friendly, accessible solution for your EPS calculation needs. By streamlining this crucial calculation, it allows you to focus more on interpreting the results and making strategic decisions based on your analysis.

We encourage you to bookmark this tool and make it a regular part of your financial analysis toolkit. Remember, while EPS is a crucial metric, it should be considered alongside other financial ratios and indicators for a comprehensive understanding of a company’s financial health and performance.

Start using our EPS Calculator today and take your financial analysis to the next level!

Important Disclaimer

The calculations, results, and content provided by our tools are not guaranteed to be accurate, complete, or reliable. Users are responsible for verifying and interpreting the results. Our content and tools may contain errors, biases, or inconsistencies. We reserve the right to save inputs and outputs from our tools for the purposes of error debugging, bias identification, and performance improvement. External companies providing AI models used in our tools may also save and process data in accordance with their own policies. By using our tools, you consent to this data collection and processing. We reserve the right to limit the usage of our tools based on current usability factors. By using our tools, you acknowledge that you have read, understood, and agreed to this disclaimer. You accept the inherent risks and limitations associated with the use of our tools and services.
Create Your Own Web Tool for Free