Expert Market Analysis Tool: 50-Year Investor Insights for Industry Trends
Harness the power of 50 years of investment experience with our Expert Market Analysis Tool. Get in-depth insights on industry trends, growth areas, potential risks, and emerging opportunities. Perfect for both seasoned investors and industry newcomers seeking comprehensive market intelligence.
Market Analysis Generator
Generating analysis...
Market Analysis Report:
★ Add to Home Screen
×
Follow these steps:
Tap the Share button at the bottom of the browser
Scroll down and tap “Add to Home Screen”
Tap “Add” to confirm
Follow these steps:
Tap the menu icon (⋮) in the top right
Tap “Add to Home screen”
Tap “Add” to confirm
Follow these steps:
Click the menu icon (⋮) in the top right
Click “Bookmarks”
Click “Bookmark this tab” or press Ctrl+D (Cmd+D on Mac)
Is this tool helpful?
Thanks for your feedback!
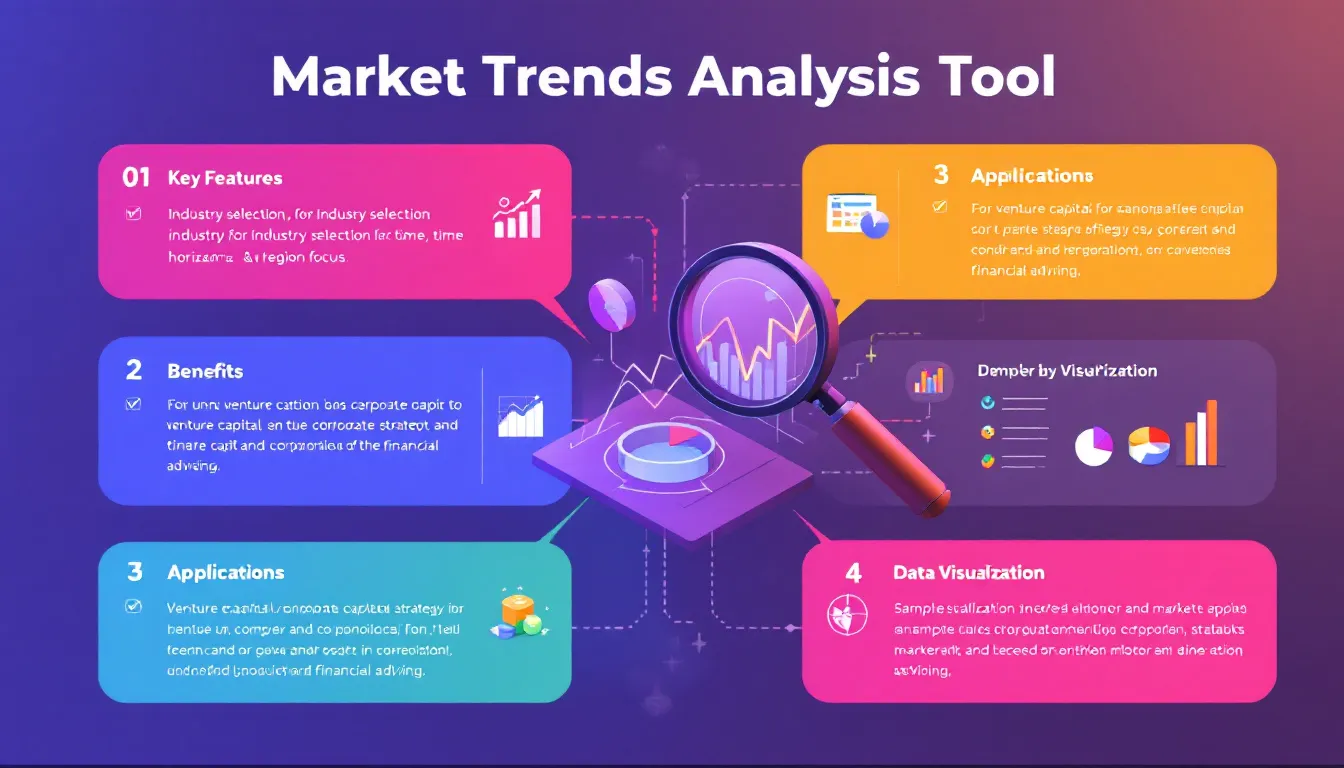
How to Use the Market Trends Analysis Tool Effectively
Our Market Trends Analysis Tool is designed to provide comprehensive insights into various industries, leveraging the expertise of a seasoned investor with 50 years of experience. To make the most of this powerful tool, follow these steps:
Select the Industry: Begin by entering the specific industry you want to analyze. For example, you might input “Technology,” “Healthcare,” or “Energy.”
Choose the Time Horizon: Select the appropriate time frame for your analysis from the dropdown menu:
Short-term (1-2 years)
Medium-term (3-5 years)
Long-term (5-10 years)
Specify the Region (Optional): If you want to focus on a particular geographic area, enter it in the Region field. For instance, you might input “North America,” “Europe,” or “Asia-Pacific.”
Define a Specific Focus (Optional): To narrow down your analysis, you can specify particular aspects or sub-sectors within the chosen industry. For example, if you’re analyzing the Energy sector, you might enter “Renewable energy” or “Oil and gas exploration.”
Generate the Analysis: Click the “Generate Market Analysis” button to process your inputs and create a comprehensive report.
After submitting your request, our tool will generate a detailed market analysis report, which you can then review, copy, or save for future reference.
Unveiling Market Insights: The Power of Our Market Trends Analysis Tool
In today’s rapidly evolving business landscape, staying ahead of market trends is crucial for investors, entrepreneurs, and business leaders. Our Market Trends Analysis Tool harnesses the power of advanced analytics and decades of investment experience to provide you with actionable insights and comprehensive market intelligence.
This innovative tool is designed to analyze complex market data, identify key growth areas, pinpoint potential risks, and uncover emerging opportunities across various industries. By leveraging the expertise of a seasoned investor with 50 years of experience, our tool offers a unique blend of data-driven analysis and seasoned market wisdom.
The Core Purpose of Our Market Trends Analysis Tool
At its heart, our tool serves several critical purposes:
To provide a clear, data-backed overview of current market conditions in specific industries
To forecast future market trends based on historical data and expert analysis
To identify potential investment opportunities and risks within chosen markets
To offer strategic recommendations tailored to different investment horizons
To present complex market data in an easily digestible format for both industry experts and novices
Key Benefits of Using Our Market Trends Analysis Tool
By utilizing our Market Trends Analysis Tool, users can enjoy a wide range of benefits that can significantly impact their decision-making processes and investment strategies:
Time-Saving Analysis: Instead of spending hours or even days poring over market reports and financial data, our tool condenses this process into minutes, providing you with a comprehensive analysis at the click of a button.
Expert Insights: Benefit from the knowledge and experience of a 50-year veteran investor, whose insights are integrated into the tool’s algorithms and analytical processes.
Customizable Focus: Tailor your analysis to specific industries, regions, and time horizons, allowing for highly relevant and targeted market insights.
Risk Mitigation: By identifying potential risks and challenges in your chosen market, the tool helps you make more informed decisions and develop strategies to mitigate potential downsides.
Opportunity Identification: Uncover emerging trends and growth areas that might not be immediately apparent, giving you a competitive edge in identifying lucrative investment opportunities.
Strategic Planning Support: Use the tool’s insights to inform your long-term strategic planning, whether you’re an investor, business owner, or corporate executive.
Educational Value: For those less familiar with specific industries or market analysis in general, the tool serves as an educational resource, providing clear explanations and context for its findings.
Data Visualization: Complex market trends are presented through easy-to-understand charts and graphs, making it simpler to grasp key concepts and trends at a glance.
Comparative Analysis: Compare different industries or regions to identify relative strengths, weaknesses, and potential cross-industry trends.
Regular Updates: Our tool is continuously updated with the latest market data and trends, ensuring that you always have access to the most current information.
Addressing User Needs and Solving Specific Problems
Our Market Trends Analysis Tool is specifically designed to address a variety of user needs and solve common problems faced by investors, business leaders, and market analysts. Let’s explore how the tool tackles these challenges through its various features and functionalities.
1. Identifying Key Growth Areas
One of the primary challenges for investors and businesses is identifying sectors and industries with the highest growth potential. Our tool addresses this need by analyzing historical data and current market conditions to forecast future growth trends.
For example, let’s consider an analysis of the renewable energy sector:
If the tool analyzes that the global solar energy market size was $52.5 billion in 2018 and is projected to reach $223.3 billion by 2026, it would calculate the CAGR as follows:
This high CAGR of 19.86% would be flagged by the tool as a key growth area within the renewable energy sector, providing users with valuable insight for potential investment opportunities.
2. Risk Assessment and Mitigation
Understanding and quantifying risk is crucial for making informed investment decisions. Our tool employs various risk assessment metrics to provide a comprehensive view of potential challenges and volatility within a given market.
One such metric is the Beta (β) coefficient, which measures the volatility or systematic risk of a security or portfolio compared to the market as a whole. The formula for Beta is:
For instance, if the tool calculates that a particular technology stock has a β of 1.2, it indicates that the stock is 20% more volatile than the market. This information helps users understand the potential risk associated with investments in that sector or company.
3. Forecasting Market Conditions
Predicting future market conditions is essential for long-term planning and strategy development. Our tool uses advanced forecasting techniques, including regression analysis, to project future trends based on historical data.
For example, using linear regression, the tool might forecast future market size based on historical data:
$$Y = a + bX$$
Where:
Y = Dependent variable (e.g., market size)
X = Independent variable (e.g., time)
a = Y-intercept
b = Slope of the line
By analyzing historical market size data over time, the tool can calculate ‘a’ and ‘b’ to forecast future market sizes, providing users with valuable projections for their chosen industry and time horizon.
4. Investment Strategy Recommendations
Based on the comprehensive analysis of growth areas, risks, and market forecasts, our tool provides tailored investment strategy recommendations. These recommendations take into account various factors, including the user’s specified time horizon and risk tolerance.
For instance, the tool might use the Sharpe Ratio to evaluate the risk-adjusted return of potential investment portfolios:
If the tool calculates a Sharpe Ratio of 1.5 for a particular investment strategy in the chosen industry, it would indicate a favorable risk-adjusted return, potentially leading to a recommendation for that strategy.
Practical Applications and Use Cases
Our Market Trends Analysis Tool has a wide range of practical applications across various industries and user profiles. Let’s explore some specific use cases to illustrate how different stakeholders can leverage the tool’s capabilities:
Scenario: A venture capital firm is looking to invest in emerging technologies within the artificial intelligence (AI) sector.
How the tool helps:
The VC firm uses the tool to analyze the AI industry, focusing on a 5-year time horizon.
The tool identifies key growth areas within AI, such as natural language processing and computer vision, showing high CAGR projections.
It also highlights potential risks, such as regulatory challenges and market saturation in certain AI applications.
Based on this analysis, the tool recommends focusing investments on AI startups specializing in enterprise solutions, as this sub-sector shows the highest growth potential with manageable risk.
2. Corporate Strategy Teams Planning Market Expansion
Scenario: A multinational corporation in the consumer goods industry is planning to expand into new geographic markets.
How the tool helps:
The strategy team uses the tool to analyze consumer goods markets in various regions, including emerging economies.
The tool provides market size forecasts, growth rates, and consumer behavior trends for each region.
It identifies potential risks such as economic instability or regulatory hurdles in certain markets.
Based on the analysis, the tool recommends prioritizing expansion into Southeast Asian markets, highlighting specific countries with the most favorable conditions for the company’s product lines.
3. Financial Advisors Guiding Client Portfolios
Scenario: A financial advisor is helping clients diversify their investment portfolios in response to changing market conditions.
How the tool helps:
The advisor uses the tool to analyze multiple industries and asset classes over various time horizons.
The tool provides risk-adjusted return metrics (like Sharpe Ratios) for different investment strategies.
It identifies emerging trends that might affect traditional portfolio allocations, such as the rise of sustainable investing.
Based on this comprehensive analysis, the tool suggests an optimal asset allocation strategy that balances growth potential with risk mitigation, tailored to different client risk profiles.
4. Entrepreneurs Identifying Business Opportunities
Scenario: An entrepreneur is looking to start a new business in the health tech sector but is unsure which specific niche to target.
How the tool helps:
The entrepreneur uses the tool to conduct a deep dive into the health tech industry, focusing on a 3-5 year time horizon.
The tool identifies rapidly growing sub-sectors within health tech, such as telemedicine and wearable health devices.
It provides market size projections, potential barriers to entry, and competitive landscape analysis for each sub-sector.
Based on this analysis, the tool recommends focusing on the intersection of AI and personalized medicine, highlighting this as an area with high growth potential and relatively low market saturation.
5. Policy Makers Shaping Economic Strategies
Scenario: Government officials are developing policies to boost economic growth and attract foreign investment.
How the tool helps:
Policy makers use the tool to analyze global industry trends and compare them with their country’s current economic strengths.
The tool provides insights into which industries are likely to drive economic growth in the coming decades.
It highlights potential challenges, such as skill gaps in the workforce or infrastructure needs for emerging industries.
Based on this analysis, the tool recommends focusing on developing specific sectors (e.g., renewable energy and advanced manufacturing) and suggests policy measures to attract investment in these areas.
Frequently Asked Questions (FAQ)
Q1: How often is the data in the Market Trends Analysis Tool updated?
A1: Our tool is continuously updated with the latest market data and trends. We source information from reputable financial databases, government reports, and industry publications to ensure that you always have access to the most current and relevant information for your analysis.
Q2: Can I analyze multiple industries or regions simultaneously?
A2: While the tool is designed to provide in-depth analysis for one industry and region at a time, you can certainly run multiple analyses sequentially. This allows you to compare different industries or regions by generating separate reports and comparing the results side by side.
Q3: How does the tool account for unexpected market disruptions or black swan events?
A3: Our tool incorporates historical data on market volatility and uses advanced risk assessment models to factor in the potential for unexpected events. However, it’s important to note that no tool can predict black swan events with certainty. We recommend using the tool’s insights in conjunction with other sources of market intelligence and your own judgment.
Q4: Can I customize the output format of the analysis report?
A4: Currently, the tool provides a standardized report format that includes key metrics, charts, and recommendations. While you can’t customize the format directly, you can easily copy the content to other applications for further customization or presentation purposes.
Q5: How does the tool’s 50-year investment experience factor into the analysis?
A5: The 50 years of investment experience is integrated into the tool’s algorithms and analytical processes. This expertise influences how the tool interprets data, weighs different factors, and formulates recommendations. It provides a valuable layer of seasoned judgment on top of the raw data analysis.
Q6: Can the tool analyze niche or emerging industries that might not have extensive historical data?
A6: Yes, the tool is capable of analyzing emerging industries. In cases where historical data is limited, it leverages data from related sectors, applies trend analysis from similar historical situations, and incorporates expert insights to provide the most accurate projections possible.
Q7: Is the tool suitable for both short-term trading and long-term investment planning?
A7: The tool is designed to be versatile and can provide insights for both short-term and long-term strategies. By selecting different time horizons in your analysis, you can tailor the output to suit your specific needs, whether you’re looking at immediate market movements or planning for decades ahead.
Q8: How does the tool handle conflicting data or trends?
A8: When confronted with conflicting data or trends, our tool uses advanced statistical methods to weigh the reliability and relevance of different data points. It presents a balanced view in the analysis, often highlighting these conflicts as areas of potential opportunity or risk that require further investigation.
Q9: Can I integrate the tool’s outputs with other financial software or platforms?
A9: While the tool doesn’t currently offer direct integration with other platforms, the analysis reports can be easily copied and pasted into other applications. We’re constantly working on improving the tool’s functionality and may introduce integration features in future updates.
Q10: How does the tool account for regional differences in markets and economies?
A10: The tool incorporates region-specific data and factors such as economic indicators, regulatory environments, and cultural trends into its analysis. When you specify a region in your query, the tool adjusts its analytical framework to provide insights that are relevant and accurate for that specific geographic area.
By addressing these common questions, we hope to provide a clearer understanding of our Market Trends Analysis Tool’s capabilities and how it can be effectively leveraged to gain valuable market insights and inform strategic decision-making across various industries and investment scenarios.
Important Disclaimer
The calculations, results, and content provided by our tools are not guaranteed to be accurate, complete, or reliable. Users are responsible for verifying and interpreting the results. Our content and tools may contain errors, biases, or inconsistencies. We reserve the right to save inputs and outputs from our tools for the purposes of error debugging, bias identification, and performance improvement. External companies providing AI models used in our tools may also save and process data in accordance with their own policies. By using our tools, you consent to this data collection and processing. We reserve the right to limit the usage of our tools based on current usability factors. By using our tools, you acknowledge that you have read, understood, and agreed to this disclaimer. You accept the inherent risks and limitations associated with the use of our tools and services.