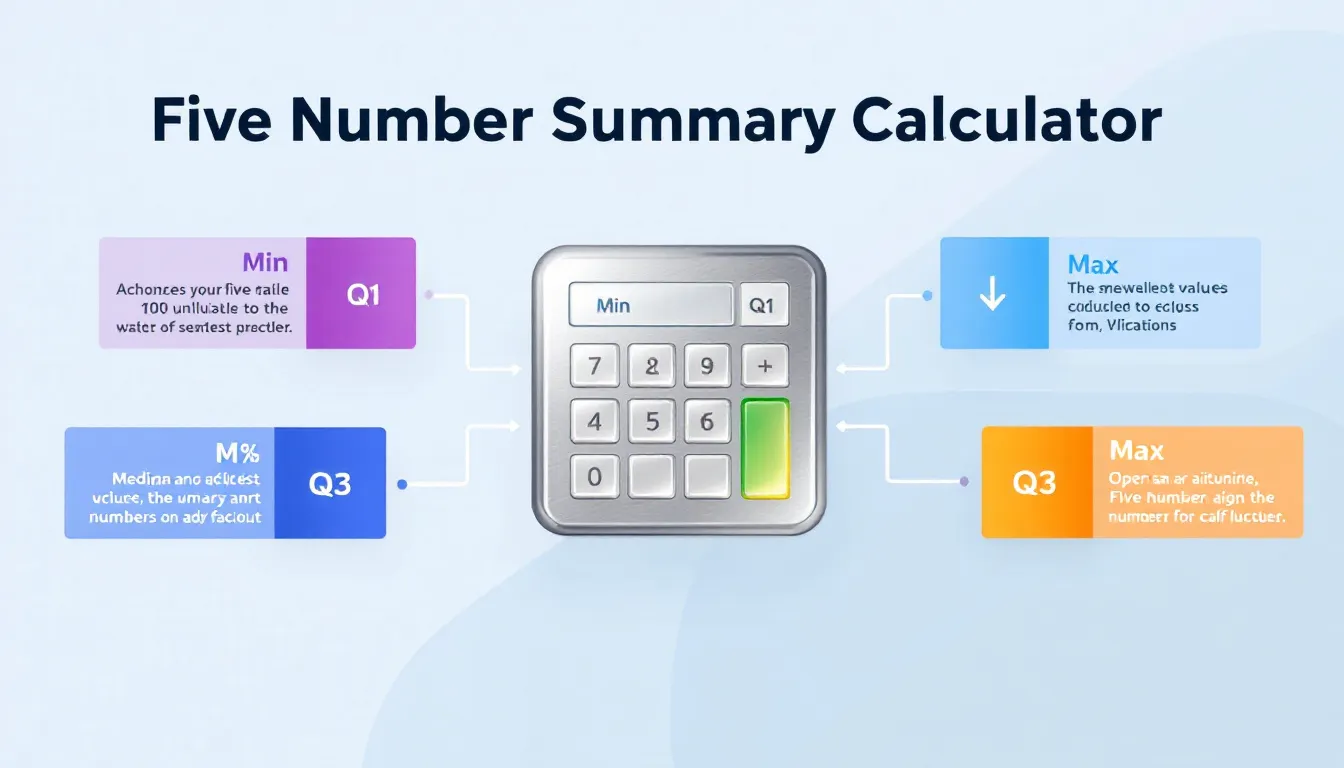
Five Number Summary Calculator
Calculating...
Is this tool helpful?
How to Use the Five Number Summary Calculator Effectively
Our intuitive Five Number Summary Calculator helps you analyze the distribution of any numerical data set quickly and accurately. Follow these steps to make the most out of this powerful statistical tool:
1. Enter Your Data
Input your numerical values into the designated text area. Numbers can be separated by commas, spaces, or line breaks. The tool accepts both integers and decimals for flexible data entry.
Sample Input 1: 12.7, 45.3, 38.9, 50.2, 41.0, 47.6, 39.8, 44.5, 36.7, 49.3
Sample Input 2: 88 92 85 79 94 90 83 87 91 89 84 86
2. Select Quartile Calculation Method
Choose from three quartile calculation methods based on your statistical preference or the standards required for your analysis:
- Method 1 (Inclusive): Includes the median in both lower and upper halves when calculating Q1 and Q3 for data sets with an odd number of points.
- Method 2 (Exclusive): Excludes the median from the halves when calculating quartiles for odd-sized data sets, resulting in different percentile boundaries.
- Method 3 (Percentile-Based): Uses positional formulas with possible interpolation to estimate quartile values precisely.
3. Enable Box Plot Visualization
For a clear graphical view of your data’s five-number summary, check the “Show Box Plot” option. This will display a box plot illustrating the distribution, spread, and potential outliers.
4. Calculate Results
Click the “Calculate” button to generate the summary statistics instantly. The output includes:
- Minimum value (smallest number)
- First Quartile (Q1)
- Median (Q2)
- Third Quartile (Q3)
- Maximum value (largest number)
- Interquartile Range (IQR)
- Mean (average value)
If enabled, a box plot will accompany the results, providing a visual summary of the data’s variability and central tendency.
5. Interpret the Results
Use the numerical summary and box plot to gain insights into the data’s distribution, spread, and any potential outliers. This makes understanding complex data sets straightforward and accessible.
6. Modify Input or Reset
To analyze another dataset or experiment with different quartile calculation methods, simply update your data or method selection and recalculate. Refresh your browser to clear all fields and start over.
Five Number Summary Calculator: Definition, Purpose, and Key Benefits
The five-number summary is an essential descriptive statistic tool that provides a complete snapshot of your data’s distribution. It concisely summarizes a dataset with five critical points: the minimum, first quartile (Q1), median (Q2), third quartile (Q3), and maximum values.
Components of the Five-Number Summary
- Minimum: The smallest observed value in the dataset.
- First Quartile (Q1): The median of the lower half of the data set, indicating the 25th percentile.
- Median (Q2): The middle value dividing the dataset into two equal halves, representing the 50th percentile.
- Third Quartile (Q3): The median of the upper half of the data set, marking the 75th percentile.
- Maximum: The largest observed value in the dataset.
Purpose and Importance
The five-number summary enables analysts and researchers to quickly:
- Understand the distribution, spread, and central tendency of the data.
- Spot outliers or extreme data points that may affect conclusions.
- Compare multiple data sets easily using a consistent set of statistics.
- Create box plots for effective visual data representation.
- Make data-driven decisions with enhanced clarity and context.
Benefits of Using the Five-Number Summary in Data Analysis
- Concise Data Overview: Reduces large datasets to five influential statistics without losing critical distribution information.
- Outlier Resistance: Less sensitive to extreme values compared to mean, giving a more robust view of data.
- Supports Visualization: Forms the basis of box plots that visually communicate data characteristics.
- Quantile Insights: Reveals how data is spread across different percentiles.
- Distribution-Agnostic: Does not assume any specific data distribution, offering wide applicability.
- Easy Comparisons: Enables straightforward comparison of data sets across studies or timeframes.
- Outlier Detection: Helps identify unusual data points needing further investigation.
Example Calculation of the Five Number Summary Using the Calculator
Below is an example demonstrating how the calculator processes a data set and outputs the five-number summary along with the interquartile range and mean.
Example Data Set:
15, 18, 22, 24, 28, 30, 35, 38, 40, 42, 45, 50, 53, 55, 60
Using Quartile Calculation: Method 1 (Inclusive)
- Minimum: 15
- Q1 (First Quartile): 24
- Median (Q2): 38
- Q3 (Third Quartile): 50
- Maximum: 60
- Interquartile Range (IQR): $$50 – 24 = 26$$
- Mean (Average): 35.5
With the “Show Box Plot” option enabled, a graphical box plot will illustrate this summary, showing the spread of data between Q1 and Q3, the median line, and whiskers extending from minimum to maximum.
This example highlights how the Five Number Summary Calculator simplifies complex data into actionable insights with just a few clicks.
Practical Applications of the Five Number Summary Calculator Across Fields
This versatile calculator is valuable for professionals in many domains, providing quick data summarization and visualization tailored to various industry needs.
1. Business and Financial Analysis
Use the calculator for stock prices, sales data, or expense reports. For example, summarizing monthly sales figures helps identify trends, outliers, and overall business performance.
2. Academic and Educational Research
Teachers and researchers can analyze test scores or survey results, enabling them to assess student performance distributions efficiently.
3. Healthcare and Medical Studies
Summarize patient measurements such as blood pressure readings or drug efficacy scores to monitor treatment outcomes and identify variability among subjects.
4. Environmental and Climate Science
Analyze temperature records, rainfall amounts, or pollutant concentrations to observe natural trends and anomalies over time or locations.
5. Manufacturing and Quality Control
Examine product dimensions or test results to ensure consistent quality and detect defects or calibration issues early in the process.
6. Sports and Performance Analytics
Summarize athlete statistics or game scores to gauge consistency, identify peak performance periods, and assist coaching strategies.
Frequently Asked Questions (FAQs) About the Five Number Summary Calculator
Q1: What differentiates the three quartile calculation methods?
The primary difference lies in how each method treats the median when calculating the first and third quartiles, particularly for datasets with an odd number of points:
- Method 1 (Inclusive): Includes the median in both halves.
- Method 2 (Exclusive): Excludes the median from the halves.
- Method 3 (Percentile-Based): Applies positional formulas with interpolation to estimate quartiles.
These differences can cause variation in quartile values, especially for smaller data sets.
Q2: How many data points should I enter for a meaningful summary?
While at least five numbers are required, having 10 to 15 or more data points is recommended for reliable and representative analysis.
Q3: Does the calculator support datasets with decimal numbers?
Yes, this tool accepts and accurately processes both integers and decimal values without any issues.
Q4: Can this calculator process non-numeric or categorical data?
No, it is designed exclusively for numerical data analysis. For categorical data, consider other statistical tools more suited to qualitative or ordinal variables.
Q5: What is the Interquartile Range (IQR), and why is it important?
The IQR represents the range between $$Q_3$$ and $$Q_1$$, capturing the middle 50% of data points. It is crucial for understanding the spread of the central data portion and is a key metric for detecting outliers.
Q6: How do I interpret the box plot generated by the calculator?
The box plot visualizes the five-number summary:
- The box spans from $$Q_1$$ to $$Q_3$$, illustrating the Interquartile Range.
- The line inside the box marks the median value.
- The whiskers extend to the minimum and maximum values.
This graphic helps rapidly assess data distribution, skewness, and variability.
Important Disclaimer
The calculations, results, and content provided by our tools are not guaranteed to be accurate, complete, or reliable. Users are responsible for verifying and interpreting the results. Our content and tools may contain errors, biases, or inconsistencies. Do not enter personal data, sensitive information, or personally identifiable information in our web forms or tools. Such data entry violates our terms of service and may result in unauthorized disclosure to third parties. We reserve the right to save inputs and outputs from our tools for the purposes of error debugging, bias identification, and performance improvement. External companies providing AI models used in our tools may also save and process data in accordance with their own policies. By using our tools, you consent to this data collection and processing. We reserve the right to limit the usage of our tools based on current usability factors.


