Free Cash Flow to Equity Calculator
Is this tool helpful?
How to use the tool
- Total Revenues ($): Type figures such as 1 450 000 or 5 250 000.
- Total Expenses ($): Enter costs like 1 050 000 or 4 100 000.
- Initial Cost of Asset ($): Use values such as 650 000 or 2 300 000.
- Lifetime of Asset (years): Add periods like 7 or 15.
- Change in PPE ($): Insert adjustments such as 60 000 or 280 000.
- Current Depreciation ($): Provide amounts like 38 000 or 190 000.
- Current Assets ($): Input figures such as 320 000 or 1 150 000.
- Current Liabilities ($): List obligations like 190 000 or 810 000.
- Amount Company Borrows ($): Enter 140 000 or 640 000.
- Debt Repaid ($): Add repayments such as 55 000 or 290 000.
- Click “Calculate FCFE” to view the breakdown and final cash available to equity holders.
Formulas used
Primary equation:
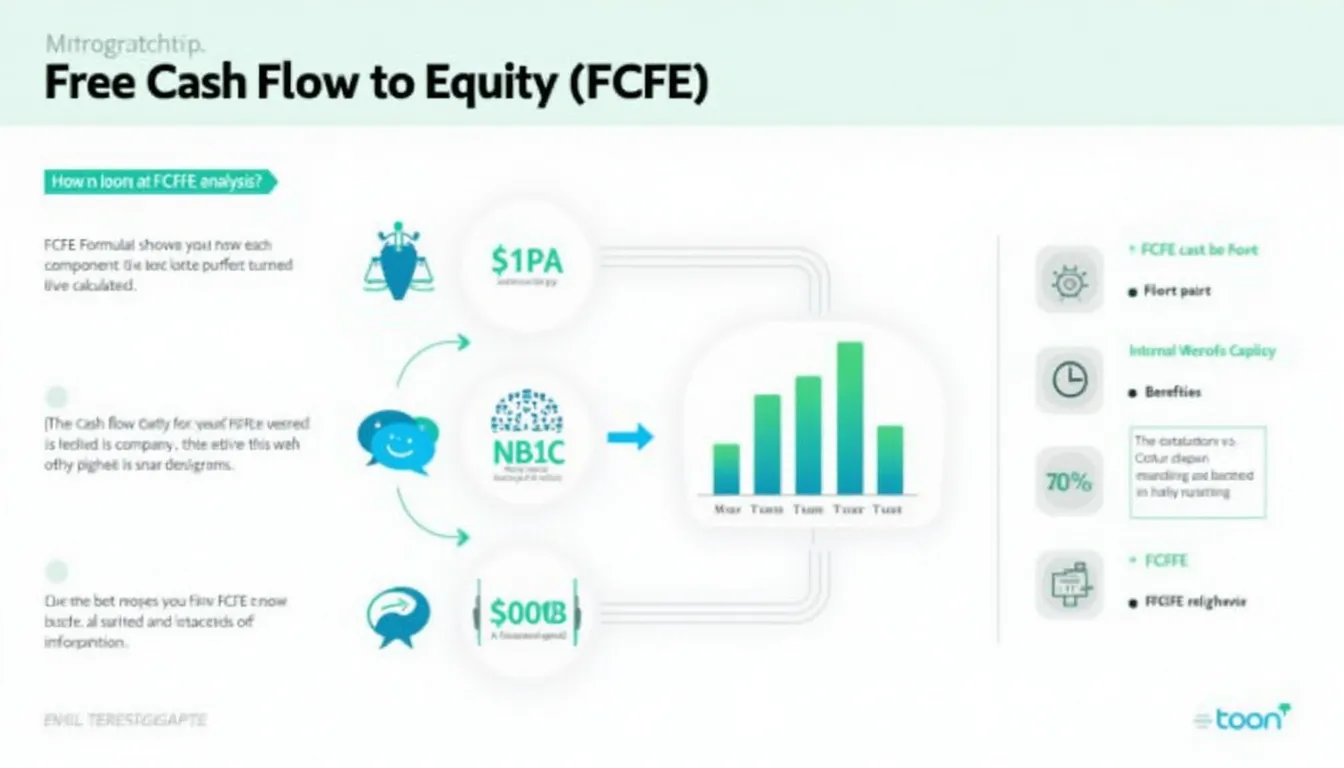
$$ \text{FCFE}= \text{Net Income} + \text{Dep\&Amort} – \text{CapEx} – \text{ΔWorking Capital} + \text{Net Borrowing} $$
- Net Income = Total Revenues − Total Expenses
- Dep&Amort = Initial Cost of Asset / Lifetime of Asset
- CapEx = Change in PPE + Current Depreciation
- ΔWorking Capital = Current Assets − Current Liabilities
- Net Borrowing = Amount Borrowed − Debt Repaid
Example calculation 1
- Total Revenues: $2 500 000
- Total Expenses: $1 900 000
- Initial Cost of Asset: $600 000
- Lifetime of Asset: 8 years
- Change in PPE: $70 000
- Current Depreciation: $45 000
- Current Assets: $350 000
- Current Liabilities: $220 000
- Amount Borrowed: $150 000
- Debt Repaid: $60 000
Step-by-step:
- Net Income = 600 000
- Dep&Amort = 75 000
- CapEx = 115 000
- ΔWorking Capital = 130 000
- Net Borrowing = 90 000
- FCFE = 520 000
Example calculation 2
- Total Revenues: $7 800 000
- Total Expenses: $6 250 000
- Initial Cost of Asset: $2 400 000
- Lifetime of Asset: 12 years
- Change in PPE: $300 000
- Current Depreciation: $220 000
- Current Assets: $1 050 000
- Current Liabilities: $890 000
- Amount Borrowed: $600 000
- Debt Repaid: $280 000
Results:
- Net Income = 1 550 000
- Dep&Amort = 200 000
- CapEx = 520 000
- ΔWorking Capital = 160 000
- Net Borrowing = 320 000
- FCFE = 1 390 000
Quick-Facts
- Standard FCFE formula appears in CFA Program Level II texts (CFA Institute, 2022).
- S&P 500 firms spent 6.5 % of revenue on CapEx in 2022 (S&P Global, 2023).
- Typical U.S. asset depreciation ranges 5-15 years (IRS Pub 946, 2023).
- Debt covenants often limit leverage to 3× EBITDA (Moody’s Corporate Finance, 2023).
FAQ
What is Free Cash Flow to Equity?
FCFE measures cash a company can distribute to shareholders after operating costs, reinvestment and net borrowing adjustments (CFA Institute, 2022).
How does the calculator estimate depreciation?
It divides the asset’s initial cost by its useful life, mirroring straight-line schedules allowed by the IRS (IRS Pub 946, 2023).
Why adjust for change in working capital?
A rise in working capital ties up cash that could otherwise reach shareholders (Damodaran, 2023).
When is FCFE preferable to Free Cash Flow to Firm?
Use FCFE when valuing equity directly, especially in highly leveraged companies (CFA Program Curriculum, 2022).
Which sectors show volatile FCFE?
Utilities display stable FCFE, while technology firms swing widely with R&D and capex cycles (PwC Global Insights, 2023).
How can investors apply FCFE to valuation?
Discount projected FCFE at the cost of equity to estimate intrinsic share value (McKinsey Valuation, 2020).
Does positive FCFE guarantee dividends?
No. Management may reinvest or repurchase shares instead, prioritising strategic goals (Harvard Business Review, 2021).
What limits net borrowing in the formula?
Credit agreements restrict new debt, and rating agencies penalise excess leverage (Moody’s Corporate Finance, 2023).
Important Disclaimer
The calculations, results, and content provided by our tools are not guaranteed to be accurate, complete, or reliable. Users are responsible for verifying and interpreting the results. Our content and tools may contain errors, biases, or inconsistencies. Do not enter personal data, sensitive information, or personally identifiable information in our web forms or tools. Such data entry violates our terms of service and may result in unauthorized disclosure to third parties. We reserve the right to save inputs and outputs from our tools for the purposes of error debugging, bias identification, and performance improvement. External companies providing AI models used in our tools may also save and process data in accordance with their own policies. By using our tools, you consent to this data collection and processing. We reserve the right to limit the usage of our tools based on current usability factors.


