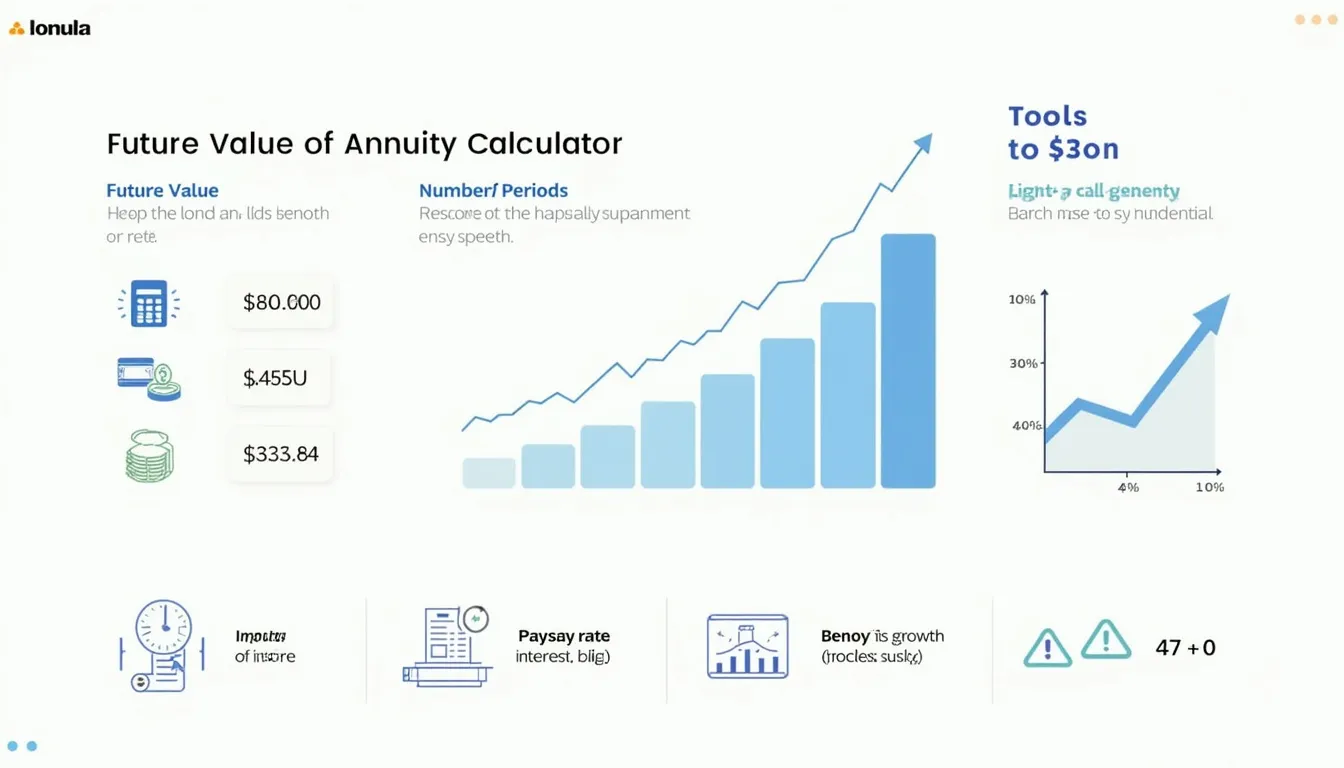
Future Value of Annuity Calculator
Is this tool helpful?
How to use the tool
- Periodic Payment – Type the size of each contribution.
Example A: $250 every month.
Example B: $800 every quarter. - Rate per Period (%) – Insert the interest or return rate for each payment interval.
Example A: 0.5 % (6 % ÷ 12).
Example B: 1.25 % (5 % ÷ 4). - Number of Periods – Enter how many times you will pay.
Example A: 240 (20 years × 12).
Example B: 48 (12 years × 4). - Press Calculate to display the future value.
Formula used
$$FV = PMT \times rac{(1+r)^n-1}{r}$$
- PMT – payment each period
- r – rate per period (decimal)
- n – number of periods
Worked example
Monthly $250 deposit, 0.5 % monthly rate, 240 periods:
$$FV = 250 \times rac{(1+0.005)^{240}-1}{0.005} \approx 250 \times 555.0 = \$138{,}750$$
Quick-Facts
- The average U.S. 401(k) return for 60 % stock/40 % bond mix is ~6 % annually (Vanguard, 2023).
- Compound interest “is interest on interest,” accelerating growth (Federal Reserve Education, 2022).
- Most annuities require fixed, equal payments by contract (SEC, 2023).
- Inflation has averaged 2.5 % per year since 2000 (BLS CPI, 2024).
FAQ
What is an annuity’s future value?
The future value is the amount your equal payments accumulate to after earning compound interest over all periods (SEC, 2023).
Does the calculator include end-of-period or beginning-of-period payments?
It assumes payments occur at each period’s end; multiply the result by (1 + r) to shift to start-of-period deposits (Ross et al., 2021).
How do I adjust for inflation?
Subtract expected inflation from your nominal rate; a 6 % return with 2 % inflation gives a 4 % real rate (Bodie, 2020).
Can I solve for the payment amount instead?
Yes. Rearrange the formula: $$PMT = FV \times rac{r}{(1+r)^n-1}$$ and iterate inputs until the displayed FV matches your goal.
What happens if I change the payment frequency?
Convert the annual rate to the new period and recalculate n; e.g., weekly payments need 52 periods per year (IRS Pub 550, 2023).
What range of rates is realistic?
Historically, diversified portfolios returned 3 %-10 % annually after inflation (Morningstar, 2023).
Is the calculation exact?
It is mathematically exact for fixed rates and payments; actual investment results vary with market volatility (FINRA, 2023).
Why is compound interest powerful?
“Earnings on prior earnings accelerate wealth creation,” notes the Federal Reserve Education site (Federal Reserve Education, 2022).
Important Disclaimer
The calculations, results, and content provided by our tools are not guaranteed to be accurate, complete, or reliable. Users are responsible for verifying and interpreting the results. Our content and tools may contain errors, biases, or inconsistencies. Do not enter personal data, sensitive information, or personally identifiable information in our web forms or tools. Such data entry violates our terms of service and may result in unauthorized disclosure to third parties. We reserve the right to save inputs and outputs from our tools for the purposes of error debugging, bias identification, and performance improvement. External companies providing AI models used in our tools may also save and process data in accordance with their own policies. By using our tools, you consent to this data collection and processing. We reserve the right to limit the usage of our tools based on current usability factors.


