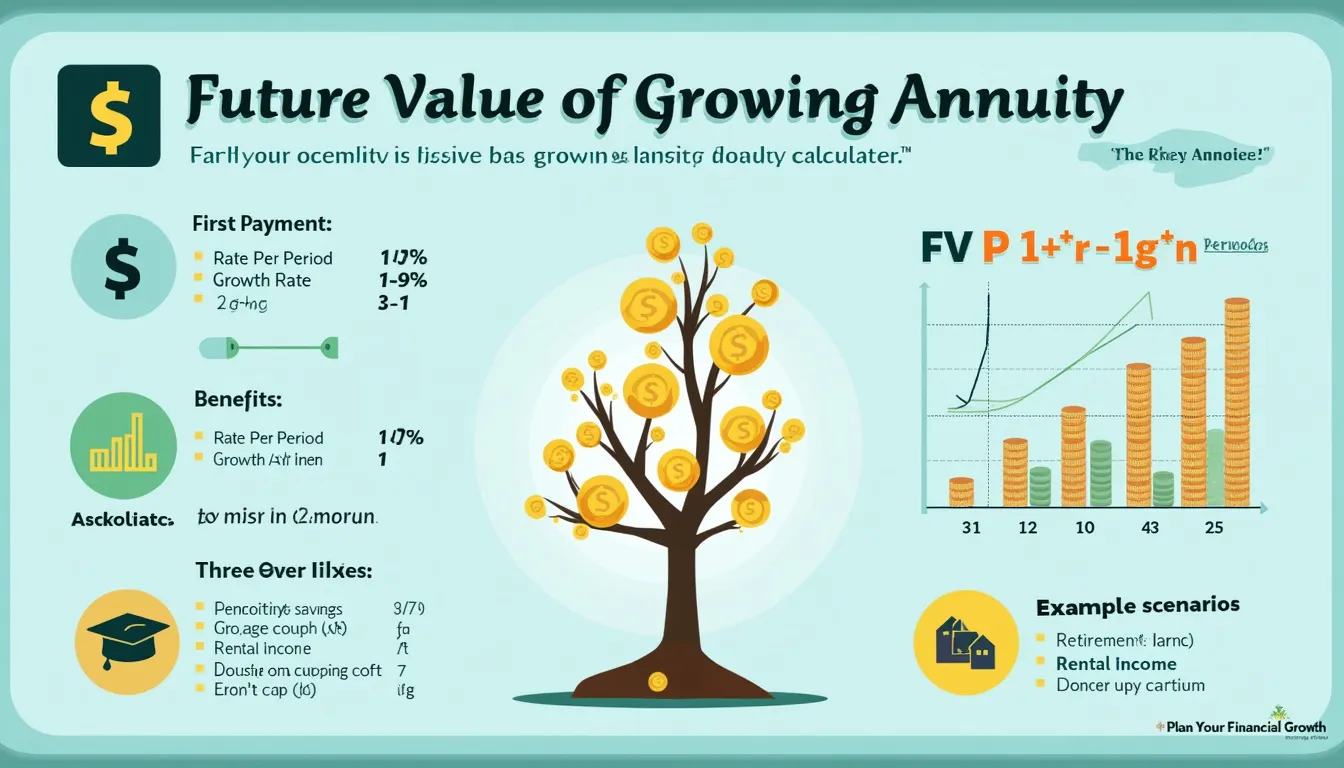
Future Value of Growing Annuity Calculator
Is this tool helpful?
How to use the tool
- First Payment ($): Type the initial contribution. Sample inputs: $750 or $2,750.
- Rate Per Period (%): Enter the expected return per period. Samples: 3.8 % or 7.25 %.
- Growth Rate (%): Key in the annual rise of each payment. Samples: 1.5 % or 4.2 %.
- Number of Periods: Specify how many equal periods the payments continue. Samples: 12 or 40.
- Calculate: Press “Calculate” to see the future value; adjust any field to rerun scenarios.
Formula & worked examples
The calculator applies the standard future-value of a growing annuity equation:
$$FV = P \times rac{(1+r)^n-(1+g)^n}{r-g}$$
- P = first payment
- r = interest rate per period (decimal)
- g = payment growth rate (decimal)
- n = number of periods
Example A
Given P = $750, r = 0.038, g = 0.015, n = 12:
- (1 + r)n = 1.5639
- (1 + g)n = 1.1955
- Fraction = (1.5639 – 1.1955)/(0.038 – 0.015) = 16.0217
- FV ≈ $12,016.28
Example B
Given P = $2,750, r = 0.0725, g = 0.042, n = 40:
- (1 + r)n = 16.388
- (1 + g)n = 5.160
- Fraction = (16.388 – 5.160)/(0.0725 – 0.042) = 368.13
- FV ≈ $1,012,358
Quick-Facts
- The equation stems from the Gordon growth model (Brealey & Myers, 2020).
- r must exceed g; otherwise FV trends to infinity (Investopedia, “Growing Annuity”).
- Average U.S. CPI inflation 1914-2022: 3.2 % (BLS, 2023).
- 2024 401(k) contribution limit: $23,000 (IRS Notice 2023-75).
FAQ
What is a growing annuity?
A growing annuity is a series of periodic payments that rise at a constant rate, commonly used to model retirement deposits or dividend streams (Ross et al., 2021).
How does the calculator determine future value?
It multiplies the first payment by a growth factor rac{(1+r)^n-(1+g)^n}{r-g}, capturing compound returns and payment increases; all arithmetic follows the CFA Institute’s Time-Value-of-Money syllabus (CFA Program Curriculum, 2022).
When should I use a negative growth rate?
Use negative g to model shrinking cash flows, such as depleting resource revenues, provided |g| < r to keep the formula valid (Investopedia, “Present Value of Growing Annuity”).
Why can’t r equal g?
If r = g, the denominator becomes zero and the formula breaks. In that case, switch to FV = P × n × (1 + r)n for equal-growth scenarios (Damodaran, 2012).
How do I adjust results for inflation?
Subtract expected inflation from r to get a real rate, then rerun the calculation; “real returns protect purchasing power” (Federal Reserve Board, 2022).
Does payment frequency affect the outcome?
Yes. Convert annual rates to the period rate (e.g., divide by 12 for monthly) and set n to total periods; compounding frequency changes FV materially (FINRA Investor Education Foundation, 2022).
What happens if g exceeds r?
The fraction turns negative, producing nonsensical values; in finance, sustainable growth must stay below discount rate to reflect risk (Brealey & Myers, 2020).
Where is this formula used in practice?
Analysts use it to price growing dividend streams, forecast pension liabilities and set sinking-fund targets (McKinsey Valuation Guide, 2023).
Important Disclaimer
The calculations, results, and content provided by our tools are not guaranteed to be accurate, complete, or reliable. Users are responsible for verifying and interpreting the results. Our content and tools may contain errors, biases, or inconsistencies. Do not enter personal data, sensitive information, or personally identifiable information in our web forms or tools. Such data entry violates our terms of service and may result in unauthorized disclosure to third parties. We reserve the right to save inputs and outputs from our tools for the purposes of error debugging, bias identification, and performance improvement. External companies providing AI models used in our tools may also save and process data in accordance with their own policies. By using our tools, you consent to this data collection and processing. We reserve the right to limit the usage of our tools based on current usability factors.


