Is this tool helpful?
How to use the tool
- Choose idea count (1-10): e.g., 2 for a quick pair or 9 for a content series.
- Describe the target audience: Add context like “College students in urban campuses” or “Senior travelers seeking budget tours”.
- Outline the product or service: Summarise its core, such as “Subscription-based language app with AR flashcards” or “Solar-powered phone charger with fast-charge tech”.
- State the value proposition: Explain uniqueness—“Masters new words in 15 min/day” or “Charges a phone to 50 % in 20 minutes off-grid”.
- Optional style inspiration: Add cues like “Isometric roadmap” or “Circular data wheel”.
- Optional formatting guidelines: Note specs such as “Use #004E89 and Montserrat” or “A4 portrait, pastel palette”.
- Click “Generate Infographic Ideas”: Wait for processing, then copy your bespoke concepts.
Quick-Facts
- Optimal infographic word count: 300-400 words (Canva, 2022).
- Visuals boost information retention to 65 % after three days (Medina, 2014).
- Posts with infographics earn 178 % more links (Moz, 2021).
- Adobe RGB colours recommended for online graphics (Adobe Guide, 2023).
Why infographics amplify your message
- Accelerated comprehension: Visual processing is 60,000 × faster than text (3M Visual Systems, 2018).
- Higher engagement: Twitter posts with infographics see 35 % more retweets (Buffer, 2020).
- Cross-channel versatility: Resize ideas for blogs, slide decks, or social stories.
- Brand cohesion: Consistent colour and typography builds recognition.
Example workflow
- Inputs: 5 ideas • Audience: “Eco-conscious teens” • Product: Plant-based snack bars • Value: “Delicious protein with 80 % smaller carbon footprint” • Inspiration: “Bar chart, Minimalist flat icons” • Format: “Instagram carousel, bold greens”.
- Outputs you could receive: “Footprint-to-Flavor bar chart”, “Protein-per-Bite icon grid”, “Snack-to-Energy timeline”, “From Farm to Lunchbox flow”, “5 Myths About Plant Protein comparison”.
FAQ
What is the Infographic Idea Generator?
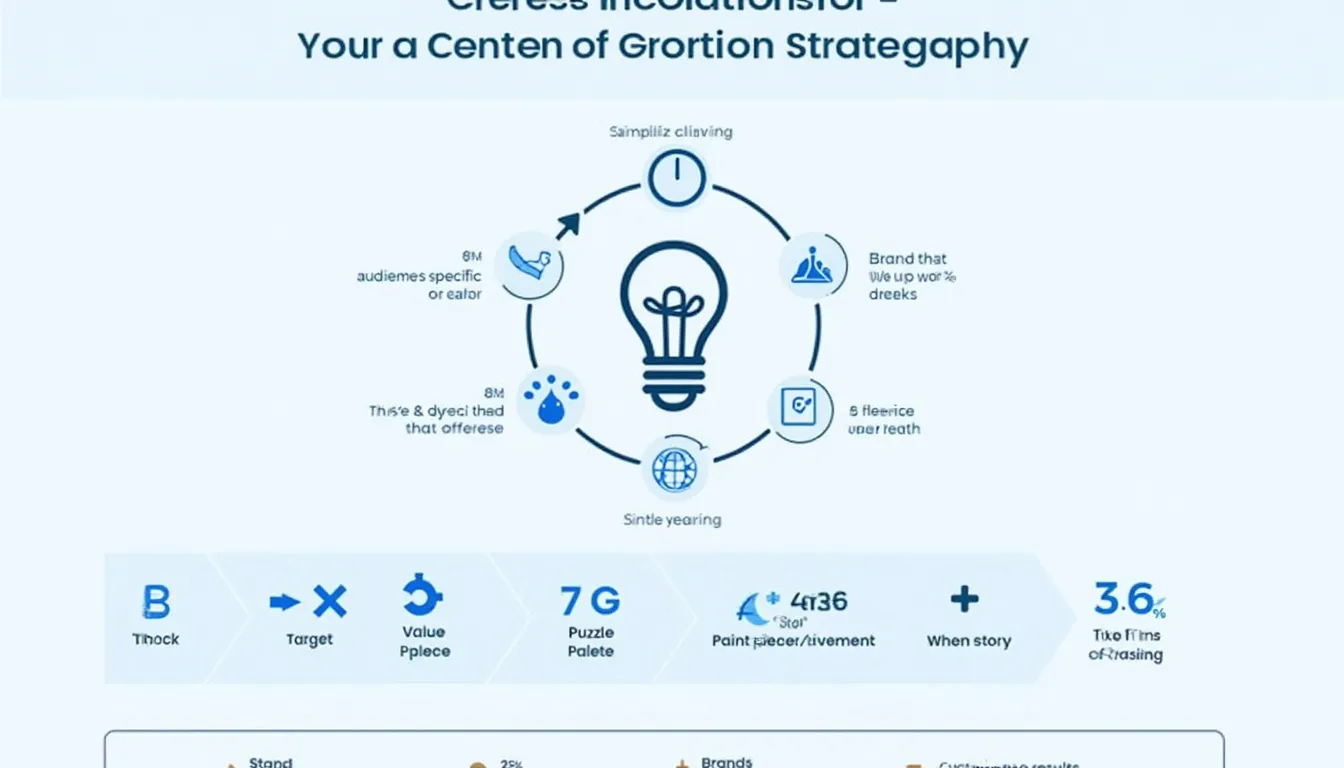
It’s an AI-powered web form that delivers custom infographic concepts based on your inputs, ready for design or content planning.
How does it personalise ideas?
The backend model cross-references your audience, product details, and value proposition to craft context-aware angles.
Which fields are mandatory?
You must enter idea count, target audience, product/service, and value proposition; style and formatting are optional but refine results.
Is there a cost to use the tool?
The generator is free for personal and commercial projects, with no download or usage fees.
What file formats do the outputs come in?
The tool provides text-based idea descriptions. You choose your preferred design software for visual production.
Can I regenerate a new set with the same inputs?
Yes. Submit identical fields again for fresh angles, expanding your creative pool without extra data entry.
How frequently should I ideate?
Content strategists plan visual assets quarterly; revisiting the tool each planning cycle keeps ideas fresh (Content Marketing Institute, 2023).
Does the tool support non-English inputs?
Yes, multilingual prompts are processed; ensure you keep input language consistent for best coherence.
Important Disclaimer
The calculations, results, and content provided by our tools are not guaranteed to be accurate, complete, or reliable. Users are responsible for verifying and interpreting the results. Our content and tools may contain errors, biases, or inconsistencies. Do not enter personal data, sensitive information, or personally identifiable information in our web forms or tools. Such data entry violates our terms of service and may result in unauthorized disclosure to third parties. We reserve the right to save inputs and outputs from our tools for the purposes of error debugging, bias identification, and performance improvement. External companies providing AI models used in our tools may also save and process data in accordance with their own policies. By using our tools, you consent to this data collection and processing. We reserve the right to limit the usage of our tools based on current usability factors.
