Geometric Mean Return Calculator: Measure Investment Performance Accurately

Unlock the power of accurate investment analysis with our Geometric Mean Return Calculator. Discover how this tool outperforms simple averages, accounts for volatility, and provides crucial insights for smarter financial decisions. Learn why savvy investors rely on geometric mean returns to evaluate long-term performance. Ready to elevate your investment strategy?

Geometric Mean Return Calculator

Enter rates as decimals (e.g., 0.05 for 5%)

How to Use the Geometric Mean Return Calculator Effectively

The Geometric Mean Return Calculator is a powerful tool designed to help investors and financial analysts accurately measure the average rate of return on investments over multiple periods. To use this calculator effectively, follow these simple steps:

  1. Locate the input field labeled “Rates of Return (comma-separated)”.
  2. Enter your rates of return as decimal values, separated by commas. For example, if you have returns of 5%, 7%, and -2%, enter them as 0.05, 0.07, -0.02.
  3. Ensure that all values are entered correctly, with no spaces between the commas.
  4. Click the “Calculate” button to generate your result.
  5. The Geometric Mean Return will be displayed as a percentage below the input field.

It’s important to note that this calculator accepts both positive and negative return values, allowing for a comprehensive analysis of your investment performance across various market conditions.

Understanding the Geometric Mean Return: Definition, Purpose, and Benefits

The Geometric Mean Return, also known as the Geometric Average Return, is a crucial metric in finance and investment analysis. It provides a more accurate representation of an investment’s performance over time compared to the simple arithmetic average, especially when dealing with a series of returns that can fluctuate significantly.

Mathematically, the Geometric Mean Return is calculated using the following formula:

$$GMR = \left(\prod_{i=1}^n (1 + r_i)\right)^{\frac{1}{n}} - 1$$

Where:

  • (GMR) is the Geometric Mean Return
  • (r_i) represents each individual rate of return
  • (n) is the number of periods

The primary purpose of using the Geometric Mean Return is to provide a more accurate measure of the compound growth rate of an investment over time. This is particularly important for investments that experience volatility, as it accounts for the compounding effect of returns.

Key Benefits of Using the Geometric Mean Return

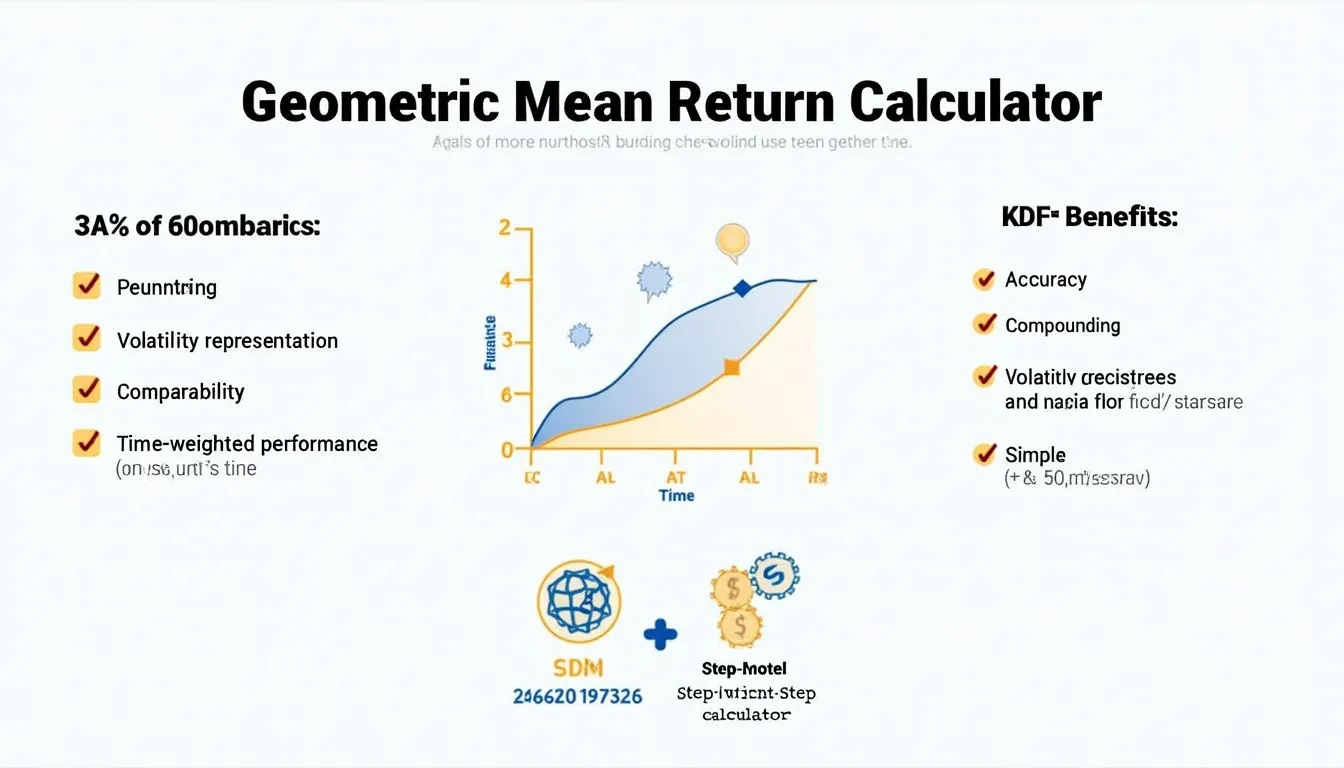
  • Accuracy in Long-Term Performance Measurement: The Geometric Mean Return provides a more precise representation of an investment’s long-term performance, especially when compared to arithmetic averages.
  • Consideration of Compounding: It takes into account the effect of compounding, which is crucial for understanding the true growth of an investment over time.
  • Realistic Representation of Volatility: The Geometric Mean Return better reflects the impact of negative returns and volatility on overall performance.
  • Comparability Across Investments: It allows for more accurate comparisons between different investments or portfolios, especially those with varying levels of volatility.
  • Time-Weighted Performance Measurement: The Geometric Mean Return is particularly useful for measuring time-weighted performance, which is essential for evaluating investment managers or strategies.

How the Geometric Mean Return Calculator Addresses User Needs

The Geometric Mean Return Calculator is designed to address several key needs of investors, financial analysts, and portfolio managers:

1. Simplifying Complex Calculations

Calculating the Geometric Mean Return manually can be time-consuming and prone to errors, especially when dealing with a large number of return periods. This calculator automates the process, allowing users to obtain accurate results quickly and effortlessly.

2. Enhancing Decision-Making

By providing a more accurate measure of investment performance, the Geometric Mean Return Calculator enables users to make better-informed decisions about their portfolios. It helps in identifying investments that have consistently performed well over time, even in the face of volatility.

3. Improving Performance Analysis

The calculator allows for a more nuanced analysis of investment performance, taking into account the compounding effect of returns. This is particularly valuable when evaluating long-term investments or comparing different investment strategies.

4. Facilitating Risk Assessment

By accurately representing the impact of negative returns and volatility, the Geometric Mean Return Calculator aids in assessing the risk associated with different investments. This is crucial for developing a balanced and risk-appropriate investment strategy.

5. Supporting Professional Reporting

For financial professionals, the calculator provides a quick and reliable way to generate performance metrics for client reports, regulatory filings, or internal analysis. This ensures consistency and accuracy in reporting across various investment products and timeframes.

Practical Applications and Use Cases

The Geometric Mean Return Calculator has a wide range of practical applications across various areas of finance and investment. Here are some specific use cases that illustrate its utility:

1. Evaluating Mutual Fund Performance

Consider a mutual fund that has delivered the following annual returns over the past five years: 8%, 12%, -5%, 15%, and 7%. Using the Geometric Mean Return Calculator, we can determine the fund’s average annual return:

Input: 0.08, 0.12, -0.05, 0.15, 0.07

Result: 7.23%

This result provides a more accurate representation of the fund’s performance compared to a simple arithmetic average, which would overstate the return at 7.4%.

2. Comparing Investment Strategies

Suppose an investor is comparing two different investment strategies over a three-year period:

Strategy A: 10%, 5%, 15%
Strategy B: 20%, -5%, 12%

Using the Geometric Mean Return Calculator:

Strategy A: Input: 0.10, 0.05, 0.15
Result: 9.97%

Strategy B: Input: 0.20, -0.05, 0.12
Result: 8.54%

Despite Strategy B having a higher arithmetic average, Strategy A actually provides a better geometric mean return, indicating superior performance when accounting for compounding effects.

3. Assessing Portfolio Performance

For a diversified portfolio that has generated the following quarterly returns: 3%, -1%, 4%, 2%, 5%, -2%, 3%, 1%

Input: 0.03, -0.01, 0.04, 0.02, 0.05, -0.02, 0.03, 0.01

Result: 1.87%

This annualized return of 7.48% (1.87% * 4) provides a more accurate representation of the portfolio’s performance over the two-year period compared to an arithmetic average.

4. Evaluating Real Estate Investments

Consider a real estate investment that has appreciated at the following annual rates over five years: 6%, 8%, 4%, 10%, 5%

Input: 0.06, 0.08, 0.04, 0.10, 0.05

Result: 6.57%

This geometric mean return provides a more accurate representation of the property’s average annual appreciation rate, accounting for compounding effects.

5. Analyzing Currency Performance

For forex traders analyzing the performance of a currency pair over a series of trading days: 0.5%, -0.3%, 0.7%, -0.2%, 0.4%

Input: 0.005, -0.003, 0.007, -0.002, 0.004

Result: 0.22%

This result provides a more accurate representation of the currency pair’s performance over the period, accounting for the compounding effect of daily returns.

Frequently Asked Questions (FAQ)

Q1: What is the difference between Geometric Mean Return and Arithmetic Mean Return?

A1: The Geometric Mean Return takes into account the compounding effect of returns over time, providing a more accurate representation of an investment’s performance, especially when there is volatility. The Arithmetic Mean Return is a simple average of returns and does not account for compounding, often overstating performance for volatile investments.

Q2: When should I use the Geometric Mean Return instead of the Arithmetic Mean Return?

A2: You should use the Geometric Mean Return when analyzing investment performance over multiple periods, especially when there is significant volatility in returns. It’s particularly useful for long-term investments, comparing different investment strategies, or evaluating time-weighted performance.

Q3: Can the Geometric Mean Return be negative?

A3: Yes, the Geometric Mean Return can be negative. This typically occurs when the overall performance of an investment over the given period is negative, even if some individual periods have positive returns.

Q4: How does the Geometric Mean Return account for risk?

A4: While the Geometric Mean Return itself doesn’t directly measure risk, it does provide a more accurate representation of returns in the presence of volatility. By accounting for the compounding effect of returns, it indirectly reflects the impact of volatility (a form of risk) on overall performance.

Q5: Can I use the Geometric Mean Return Calculator for any time period?

A5: Yes, you can use the calculator for any time period as long as you have the corresponding rates of return. The calculator doesn’t assume any specific time frame, so you can input daily, monthly, quarterly, or annual returns as needed.

Q6: How accurate is the Geometric Mean Return Calculator?

A6: The Geometric Mean Return Calculator is designed to provide accurate results based on the inputs provided. However, it’s important to note that we can’t guarantee that the webtool or results from our webtool are always correct, complete, or reliable. Our content and tools might have mistakes, biases, or inconsistencies. Always verify important calculations and consult with a financial professional for critical decisions.

Conclusion: Harnessing the Power of the Geometric Mean Return Calculator

The Geometric Mean Return Calculator is an indispensable tool for investors, financial analysts, and portfolio managers seeking to accurately measure and compare investment performance. By providing a more precise representation of compound growth rates, it enables users to make better-informed decisions, conduct more nuanced performance analyses, and develop more effective investment strategies.

Key benefits of using this calculator include:

  • More accurate long-term performance measurement
  • Better consideration of compounding effects
  • Improved representation of volatility impact
  • Enhanced comparability across different investments
  • Support for time-weighted performance analysis

Whether you’re evaluating mutual funds, comparing investment strategies, assessing portfolio performance, or analyzing individual securities, the Geometric Mean Return Calculator provides valuable insights that can significantly improve your investment analysis process.

Take advantage of this powerful tool today to enhance your investment decision-making and gain a deeper understanding of your portfolio’s true performance. Remember, in the world of finance, accurate performance measurement is the foundation of successful investing.

Important Disclaimer

The calculations, results, and content provided by our tools are not guaranteed to be accurate, complete, or reliable. Users are responsible for verifying and interpreting the results. Our content and tools may contain errors, biases, or inconsistencies. We reserve the right to save inputs and outputs from our tools for the purposes of error debugging, bias identification, and performance improvement. External companies providing AI models used in our tools may also save and process data in accordance with their own policies. By using our tools, you consent to this data collection and processing. We reserve the right to limit the usage of our tools based on current usability factors. By using our tools, you acknowledge that you have read, understood, and agreed to this disclaimer. You accept the inherent risks and limitations associated with the use of our tools and services.
Create Your Own Web Tool for Free