Herfindahl Index Calculator
Is this tool helpful?
How to use the tool
- Enter market shares: Type every firm’s share as a whole number (no % sign) separated by spaces.
Example inputs: 55 25 15 5 | 12 18 20 25 25 - Check totals: The figures do not have to sum to 100, but each must sit between 0 and 100.
- Click “Calculate”: The tool squares each share, sums the results, and returns the HHI.
- Read the colour cue: Green border = valid input; red border = error.
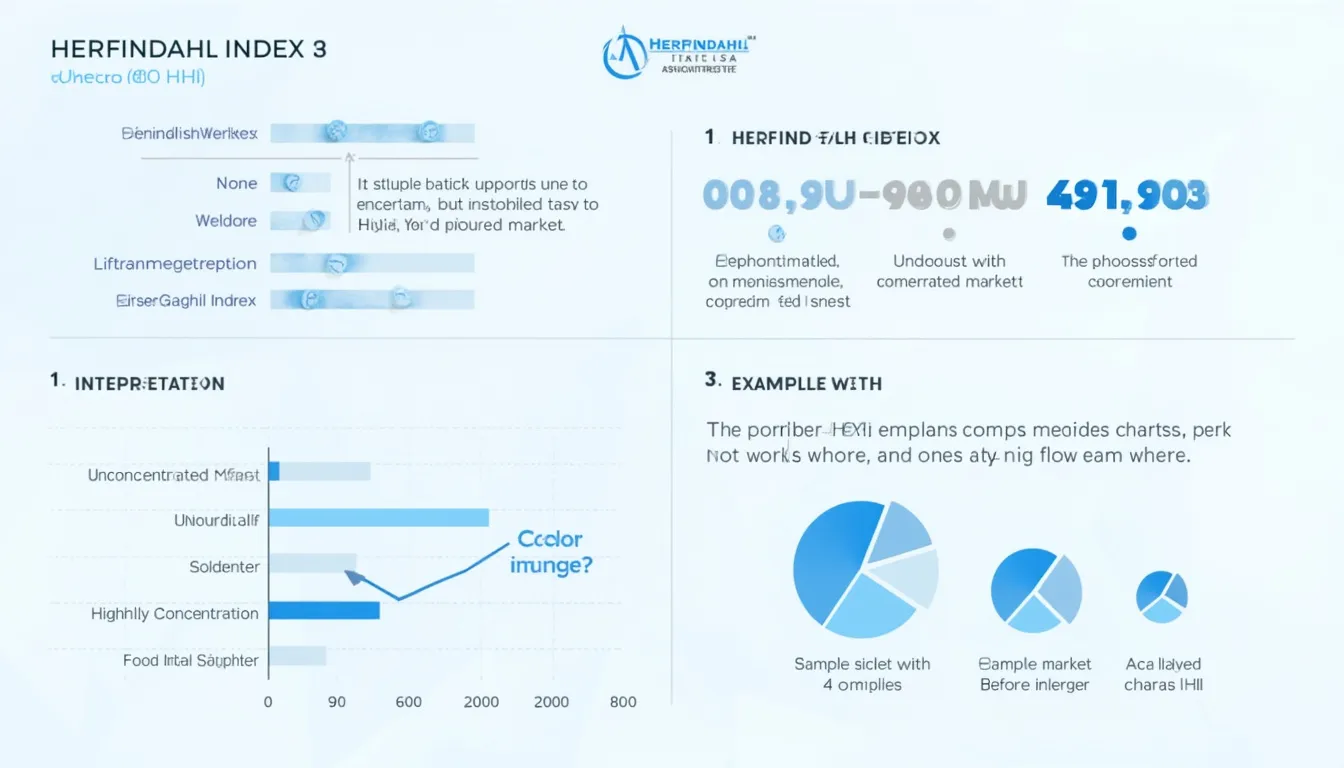
Formula
$$H=\sum_{i=1}^{N}s_i^2$$
- si = firm i’s market share (0-100).
- N = number of firms.
Example 1
Input 55 25 15 5:
- 55² = 3 025
- 25² = 625
- 15² = 225
- 5² = 25
- HHI = 3 900 → highly concentrated.
Example 2
Input 12 18 20 25 25:
- 12² = 144
- 18² = 324
- 20² = 400
- 25² = 625
- 25² = 625
- HHI = 2 118 → moderately concentrated.
Quick-Facts
- HHI spans 0 (perfect competition) to 10 000 (monopoly) (OECD Glossary, 2022).
- U.S. DOJ flags markets >2 500 as “highly concentrated” (DOJ Merger Guidelines, 2023).
- EU considers an HHI increase of >150 in already concentrated markets as problematic (EC Guidelines, 2010).
- An HHI drop of 100 points can signal entry of a viable competitor (Baker & Shapiro, 2019).
FAQ
What is the Herfindahl-Hirschman Index?
The HHI is a concentration metric that sums the squares of all firms’ market-share percentages, giving greater weight to larger firms (OECD Glossary, 2022).
How do regulators read HHI scores?
U.S. antitrust agencies treat scores <1 500 as unconcentrated, 1 500-2 500 as moderate, and >2 500 as high concentration (DOJ, 2023).
Why square the market shares?
Squaring magnifies big players’ influence, aligning the index with monopoly power theory (“Squaring reflects the disproportionate impact of large firms,” DOJ Tech Note, 2021).
Can HHI ever exceed 10 000?
No. A single firm with 100 % share yields 10 000; additional firms lower the total (EC Guidelines, 2010).
How do I convert revenue to market share?
Divide each firm’s revenue by total industry revenue, multiply by 100, then enter those percentages (Investopedia, 2024).
How often should I recalculate HHI?
Quarterly in dynamic sectors like tech; annually in stable utilities (PwC Industry Monitor, 2023).
Does a lower HHI guarantee consumer welfare?
Not always; product differentiation and innovation also affect welfare (Baker & Shapiro, 2019).
How does HHI help merger analysis?
Regulators compare pre- and post-merger HHIs; an increase over 200 in a concentrated market raises red flags (DOJ, 2023).
Important Disclaimer
The calculations, results, and content provided by our tools are not guaranteed to be accurate, complete, or reliable. Users are responsible for verifying and interpreting the results. Our content and tools may contain errors, biases, or inconsistencies. Do not enter personal data, sensitive information, or personally identifiable information in our web forms or tools. Such data entry violates our terms of service and may result in unauthorized disclosure to third parties. We reserve the right to save inputs and outputs from our tools for the purposes of error debugging, bias identification, and performance improvement. External companies providing AI models used in our tools may also save and process data in accordance with their own policies. By using our tools, you consent to this data collection and processing. We reserve the right to limit the usage of our tools based on current usability factors.