Inflation Calculator
Is this tool helpful?
How to use the tool
- Original amount ($) – Type any figure, e.g., 350.75 or 1 250.00.
- Initial year – Pick the year the money was spent or earned, such as 1968 or 2005.
- Final year – Select the year for comparison, for instance 2020 or 2015.
- Calculate – The tool returns the adjusted amount, total inflation, and average yearly inflation.
Formulas applied
- Adjusted amount: $$\text{Adjusted}=A_{0} rac{\text{CPI}_{f}}{\text{CPI}_{i}}$$
- Total inflation (%) : $$\text{Inflation}= rac{\text{CPI}_{f}-\text{CPI}_{i}}{\text{CPI}_{i}}\times100$$
- Average annual rate (%) : $$\text{Annual}= \left( rac{\text{CPI}_{f}}{\text{CPI}_{i}}\right)^{1/n}-1\;,$$ where n = years between i and f.
Worked examples
1. $350.75 from 1968 → 2020
- CPI 1968 = 34.8; CPI 2020 = 258.8 (BLS CPI Tables, 2023).
- Adjusted: $350.75 × (258.8/34.8) ≈ $2 610.
- Total inflation: 643.7 %.
- Average annual inflation: 3.9 %.
2. $1 250 from 2005 → 2015
- CPI 2005 = 195.3; CPI 2015 = 237.0 (BLS CPI Tables, 2023).
- Adjusted: $1 250 × (237.0/195.3) ≈ $1 517.
- Total inflation: 21.3 %.
- Average annual inflation: 2.0 %.
Quick-Facts
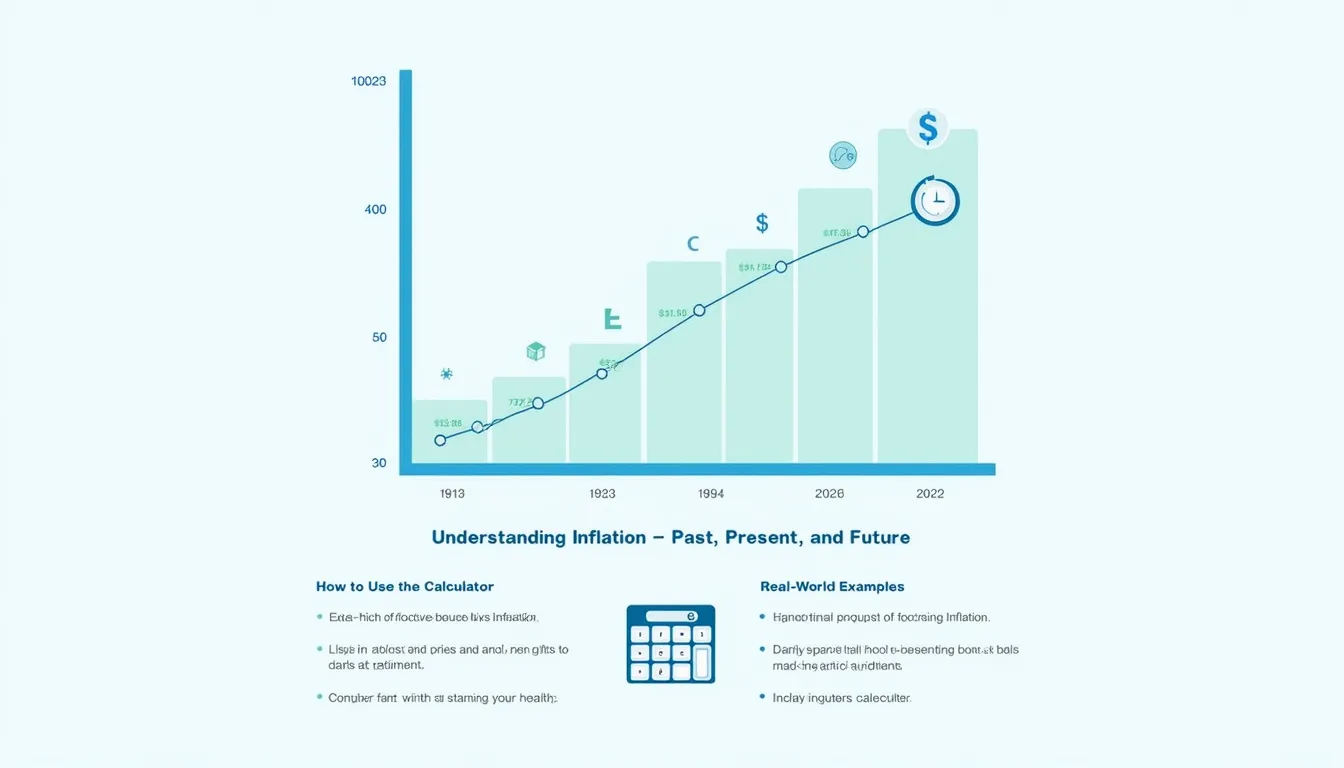
- The tool uses the U.S. All-Items CPI, available from 1913 onward (BLS CPI Databases, 2023).
- Average annual U.S. inflation 1913-2022 equals 3.1 % (Federal Reserve Economic Data, 2023).
- Largest one-year CPI jump since 1981 was 8.0 % in 2022 (BLS News Release, 2023).
- Deflation occurred in 1932 (-10.3 %) and 2009 (-0.4 %) (BLS Historical Tables, 2023).
FAQ
What does the inflation calculator do?
The calculator converts a past or future dollar amount into its equivalent buying power for another year by scaling with CPI data (BLS CPI Guide, 2023).
How reliable is the Consumer Price Index?
The CPI samples 80 000 prices monthly and is the official U.S. cost-of-living gauge; “it is the most widely used measure of inflation” (BLS Handbook, 2022).
Why choose CPI instead of the GDP deflator?
CPI focuses on household purchases, while the GDP deflator covers all domestic production; personal budgeting therefore aligns better with CPI (IMF Statistics, 2022).
Can the tool handle deflation?
Yes. When CPIf < CPIi, formulas return negative inflation and a smaller adjusted amount, reflecting lower price levels.
How often is data updated?
The CPI series is revised every month; the calculator can refresh as soon as BLS publishes the update, usually mid-month (BLS Schedule, 2023).
Does regional inflation matter?
Regional price changes differ, but national CPI still guides long-term planning; supplement with local CPI for precise budgeting (BLS Regional Data, 2023).
Is average annual inflation always lower than total inflation?
Yes, because it expresses the compound yearly rate needed to reach the total change; it smooths year-to-year volatility.
How can businesses use the output?
Firms adjust wages, renegotiate contracts, and set pricing strategies to keep margins above the historical average 3 % inflation benchmark (U.S. Chamber Economic Forecast, 2023).
Important Disclaimer
The calculations, results, and content provided by our tools are not guaranteed to be accurate, complete, or reliable. Users are responsible for verifying and interpreting the results. Our content and tools may contain errors, biases, or inconsistencies. Do not enter personal data, sensitive information, or personally identifiable information in our web forms or tools. Such data entry violates our terms of service and may result in unauthorized disclosure to third parties. We reserve the right to save inputs and outputs from our tools for the purposes of error debugging, bias identification, and performance improvement. External companies providing AI models used in our tools may also save and process data in accordance with their own policies. By using our tools, you consent to this data collection and processing. We reserve the right to limit the usage of our tools based on current usability factors.
