Is this tool helpful?
How to Use the Infographic Content Brief Generator
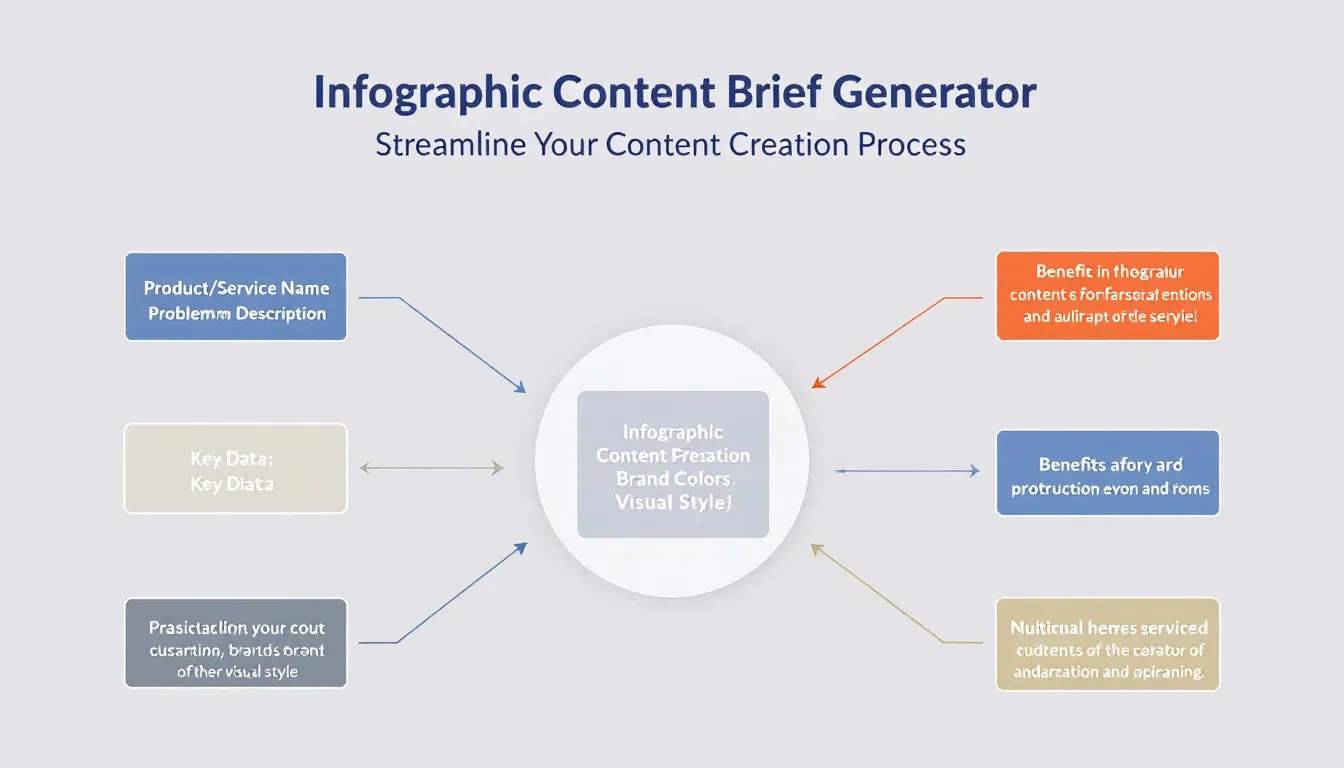
Our Infographic Content Brief Generator simplifies the process of creating compelling visual content briefs by guiding you through essential elements step by step. Here’s a detailed walkthrough of each field and how to use them effectively:
Step-by-Step Input Guide
- Product or Service Name: Enter the specific name of what you’re showcasing. Example inputs:
- “EcoSmart Solar Panels Plus”
- “WorkFlow Pro Project Management Suite”
- Problem/Solution Description: Detail the key challenge your product addresses. Be specific and focus on pain points. Example inputs:
- “Rising energy costs and environmental impact of traditional electricity sources, coupled with the complexity of transitioning to renewable energy”
- “Team collaboration inefficiencies leading to missed deadlines and communication gaps in remote work environments”
- Key Data Points: List relevant statistics that support your message. Example inputs:
- “45% average reduction in energy bills, 87% customer satisfaction, 25-year warranty, 0% carbon footprint”
- “200% increase in team productivity, 89% reduction in missed deadlines, supports 50+ file formats”
Understanding the Infographic Content Brief Generator
This tool streamlines the process of creating professional infographic briefs by combining strategic content planning with visual elements. It helps marketing professionals, content creators, and business owners develop clear, compelling briefs that will guide the creation of effective infographics.
Core Features and Capabilities
- Structured input fields for comprehensive brief development
- Optional brand customization elements
- Visual style guidance integration
- Automated brief generation based on input parameters
- Copy-to-clipboard functionality for easy sharing
Benefits of Using the Infographic Content Brief Generator
Time and Resource Optimization
Using this tool provides significant time savings through:
- Streamlined brief creation process
- Standardized format for consistent outputs
- Reduced revision cycles with designers
- Quick implementation of brand guidelines
Enhanced Communication
The tool facilitates better communication between stakeholders by:
- Creating clear, structured briefs
- Ensuring all essential elements are included
- Maintaining consistency across projects
- Providing a sharable format for team collaboration
Strategic Implementation and Problem-Solving
Addressing Content Creation Challenges
The generator effectively solves common infographic development issues:
- Inconsistent brief formats
- Missing crucial information
- Unclear visual direction
- Brand inconsistency
Quality Assurance Features
The tool ensures quality through:
- Required field validation
- Structured data input
- Guided content organization
- Brand alignment options
Practical Applications and Use Cases
Marketing Campaigns
Marketing professionals can utilize the tool for:
- Product launch infographics
- Campaign performance visualizations
- Customer journey mapping
- Market research presentations
Business Communications
Business users can create briefs for:
- Annual report highlights
- Company milestones
- Process workflows
- Team structure visualization
Educational Content
Educational institutions can develop briefs for:
- Course overviews
- Learning outcomes
- Student achievement data
- Research findings
Frequently Asked Questions (FAQ)
Can I save multiple versions of my content brief?
Yes, you can generate multiple briefs and save them by copying the content to your preferred storage location. This allows you to create variations for different audiences or purposes.
How detailed should my problem description be?
Your problem description should be specific enough to clearly communicate the challenge while being concise enough to maintain reader interest. Aim for 2-3 sentences that capture the core issue.
What types of data points work best in infographics?
The most effective data points are those that clearly demonstrate value or impact. Focus on statistics that show clear benefits, comparisons, or improvements. Use a mix of percentages, absolute numbers, and time-based metrics.
Should I include my company logo specifications in the brand colors section?
Yes, including your logo colors in the brand colors section helps maintain visual consistency. You can list both primary and secondary brand colors to ensure the infographic aligns with your visual identity.
How can I ensure my infographic brief will resonate with my target audience?
Focus on including data points and problem statements that directly address your audience’s pain points and interests. Use industry-specific examples and terminology that your audience will recognize and relate to.
Can I use the generated brief for multiple design formats?
Yes, the brief generator creates content that can be adapted for various visual formats, including static infographics, interactive graphics, social media visuals, and presentation slides.
What makes an effective style description?
An effective style description combines visual direction (modern, classic, minimalist) with specific elements like preferred iconography, typography preferences, and layout suggestions. Be specific but leave room for designer creativity.
How often should I update my infographic content?
Regular updates are recommended when key statistics change, new features are added, or market conditions evolve. Consider reviewing and updating your infographic content quarterly or semi-annually.
Important Disclaimer
The calculations, results, and content provided by our tools are not guaranteed to be accurate, complete, or reliable. Users are responsible for verifying and interpreting the results. Our content and tools may contain errors, biases, or inconsistencies. We reserve the right to save inputs and outputs from our tools for the purposes of error debugging, bias identification, and performance improvement. External companies providing AI models used in our tools may also save and process data in accordance with their own policies. By using our tools, you consent to this data collection and processing. We reserve the right to limit the usage of our tools based on current usability factors. By using our tools, you acknowledge that you have read, understood, and agreed to this disclaimer. You accept the inherent risks and limitations associated with the use of our tools and services.
