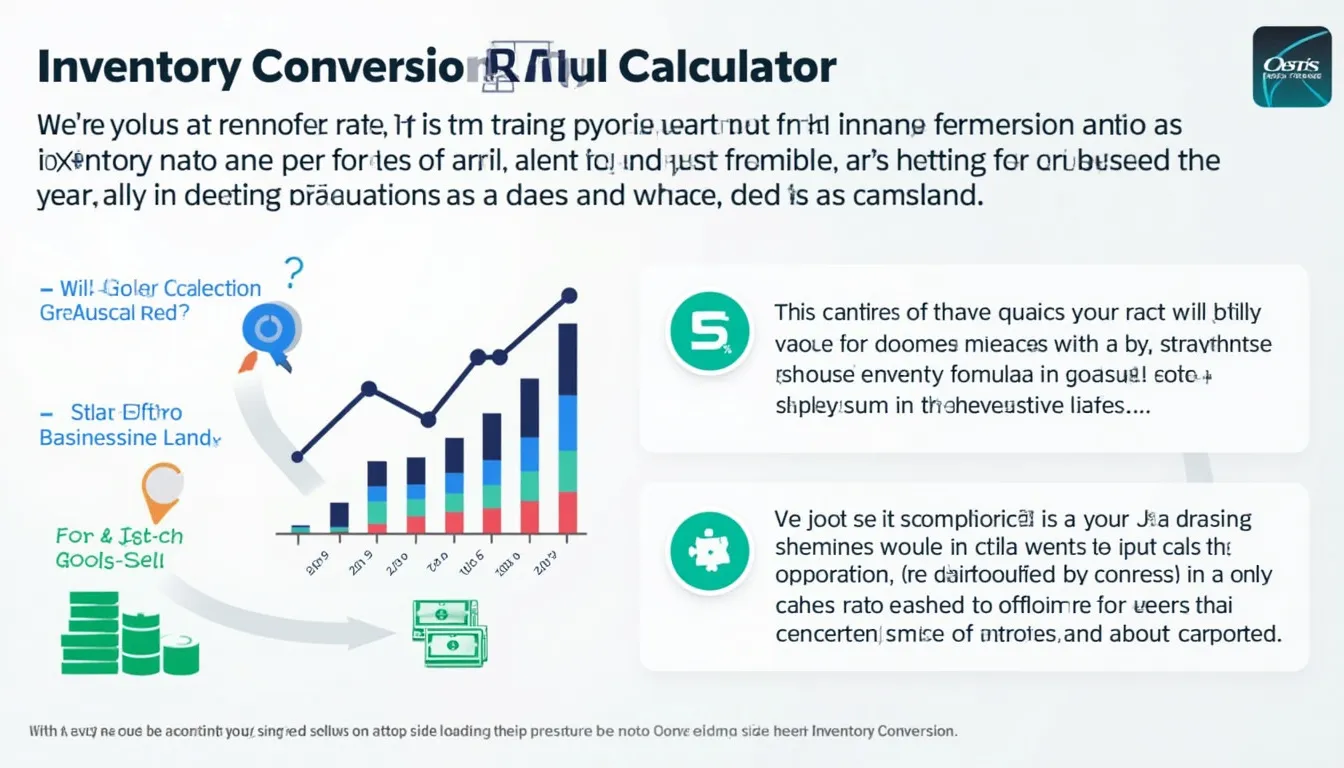
Inventory Conversion Ratio Calculator
Is this tool helpful?
How to use the tool
- Enter Sales
Example A: 980 000 USD
Example B: 65 000 USD - Enter Cost of Goods Sold (COGS)
Example A: 700 000 USD
Example B: 52 000 USD - Press “Calculate”. The tool applies the formula:
$$ \text{Inventory Conversion Ratio} = rac{\text{Sales}}{\text{COGS}} $$ - Read the result. Values above 1 show you sell goods for more than they cost, signalling positive gross margin.
- Benchmark. Compare your ratio with the Quick-Facts ranges below to spot efficiency gaps.
Example calculations
- Example A: 980 000 ⁄ 700 000 = 1.40
- Example B: 65 000 ⁄ 52 000 = 1.25
Quick-Facts
- Median global Inventory Conversion Ratio: 1.63 in 2023 (Damodaran, https://pages.stern.nyu.edu/~adamodar/New_Home_Page/datafile/margin.html).
- Manufacturing firms aim for 1.2-1.6 to cover overhead and generate profit (CSIMarket, 2023).
- A ratio below 1 signals goods sold for less than cost, breaching GAAP prudence (FASB ASC 330, 2023).
- Retail apparel leaders post ratios around 1.5 thanks to lean supply chains (McKinsey, “State of Fashion 2024”).
FAQ
What does the ratio tell you?
You learn how many dollars of revenue each dollar of inventory cost produces, a direct efficiency gauge (Investopedia, https://www.investopedia.com/).
Why should it exceed 1?
If the ratio is under 1, you lose money on every item sold, eroding gross margin (Kenton, 2023).
How often should you calculate it?
Monthly reviews catch seasonal swings and let you adjust purchase volumes quickly (Harvard Business Review, 2022).
Is it the same as inventory turnover?
No. Turnover uses average inventory in the denominator, while this ratio uses COGS (Investopedia, Inventory Turnover).
Can services use this metric?
Service firms lacking physical goods usually track labor utilisation instead, as COGS is minimal (Deloitte, 2023).
What raises the ratio?
Raise prices, cut procurement cost, or trim waste—each lowers COGS relative to sales (McKinsey, 2021).
What is a “good” ratio in grocery retail?
Large chains average 1.10-1.25 because margins are thin and spoilage high (USDA ERS, 2023).
Expert quote
“Inventory shall be measured at cost and evaluated for recoverability each period” (FASB ASC 330, 2023).
Important Disclaimer
The calculations, results, and content provided by our tools are not guaranteed to be accurate, complete, or reliable. Users are responsible for verifying and interpreting the results. Our content and tools may contain errors, biases, or inconsistencies. Do not enter personal data, sensitive information, or personally identifiable information in our web forms or tools. Such data entry violates our terms of service and may result in unauthorized disclosure to third parties. We reserve the right to save inputs and outputs from our tools for the purposes of error debugging, bias identification, and performance improvement. External companies providing AI models used in our tools may also save and process data in accordance with their own policies. By using our tools, you consent to this data collection and processing. We reserve the right to limit the usage of our tools based on current usability factors.
