Inventory Turnover Ratio Calculator
Is this tool helpful?
How to use the tool
- Enter sales: Type your revenue for the period. Example A—$750 000; Example B—$1 230 000.
- Enter average inventory: Add beginning plus ending stock, divide by two, then type the figure. Example A—$150 000; Example B—$410 000.
- Press “Calculate” to display the turnover ratio.
Formula
$$ \text{Inventory Turnover Ratio} = rac{\text{Sales}}{\text{Average Inventory}} $$
Example calculations
- Example A: 750 000 / 150 000 = 5.00 turns.
- Example B: 1 230 000 / 410 000 = 3.00 turns.
Quick-Facts
- Standard formula uses net sales and average cost of inventory (Investopedia, https://www.investopedia.com/terms/i/inventoryturnover.asp).
- Median U.S. retail turnover ≈ 3.5 per year (U.S. Census Bureau, 2022 Monthly Retail Trade).
- Grocery stores reach 15 turns due to perishables (FMI “The Food Retailing Industry Speaks 2021”).
- Carrying inventory costs 20-30 % of its value annually (CSCMP State of Logistics Report 2023).
- APICS notes: “Inventory turns signal production-planning efficiency” (APICS Dictionary, 16th ed.).
FAQ
What is the inventory turnover ratio?
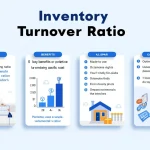
The ratio shows how many times you sell and replace stock during a period, highlighting inventory efficiency (Investopedia, https://www.investopedia.com/terms/i/inventoryturnover.asp).
Why does a higher ratio matter?
More turns mean less cash tied up in stock and lower carrying costs, improving liquidity and return on assets (CSCMP 2023).
How often should I calculate it?
Quarterly works for most firms; fast-moving sectors run it monthly for tighter control (Harvard Business Review, https://hbr.org/finance).
What is a good benchmark?
Retail targets 2-4 turns; groceries aim for double-digit turns because perishables spoil quickly (FMI 2021).
Can the ratio be too high?
Yes. Extremely high turns risk stockouts and lost sales, hurting customer satisfaction (APICS Dictionary, 16th ed.).
How can I improve my ratio?
Trim safety stock, tighten demand forecasts, and negotiate shorter supplier lead-times to boost turns (McKinsey & Company Report 2022).
How does it relate to DSI?
Days Sales of Inventory equals 365 divided by turnover; lower DSI signals faster inventory clearance (SEC Regulation S-X).
Does seasonality affect interpretation?
Yes. Compute separate ratios for peak and off-peak seasons to avoid distorted yearly averages (U.S. Small Business Administration, sba.gov guide).
Important Disclaimer
The calculations, results, and content provided by our tools are not guaranteed to be accurate, complete, or reliable. Users are responsible for verifying and interpreting the results. Our content and tools may contain errors, biases, or inconsistencies. Do not enter personal data, sensitive information, or personally identifiable information in our web forms or tools. Such data entry violates our terms of service and may result in unauthorized disclosure to third parties. We reserve the right to save inputs and outputs from our tools for the purposes of error debugging, bias identification, and performance improvement. External companies providing AI models used in our tools may also save and process data in accordance with their own policies. By using our tools, you consent to this data collection and processing. We reserve the right to limit the usage of our tools based on current usability factors.
