Inventory Turnover Ratio Calculator: Optimize Your Stock Management

Unlock the power of efficient inventory management with our Inventory Turnover Ratio Calculator. Discover how this essential metric can boost your cash flow, reduce costs, and enhance profitability. Learn to make data-driven decisions that keep you ahead of the competition. Ready to optimize your stock levels? Find out how now!

Inventory Turnover Ratio Calculator

Enter the total cost of goods sold during the period.

Enter the value of inventory at the start of the period.

Enter the value of inventory at the end of the period.

How to Use the Inventory Turnover Ratio Calculator Effectively

Our Inventory Turnover Ratio Calculator is designed to help businesses quickly and accurately determine how efficiently they’re managing their inventory. To use this tool effectively, follow these simple steps:

  1. Enter the Cost of Goods Sold (COGS): Input the total cost of goods sold during the period you’re analyzing. This figure represents the direct costs attributable to the production of the goods sold by your company.
  2. Input the Beginning Inventory: Enter the value of your inventory at the start of the period you’re examining. This is typically the ending inventory from the previous period.
  3. Provide the Ending Inventory: Enter the value of your inventory at the end of the period you’re analyzing.
  4. Click “Calculate”: Once you’ve entered all the required information, click the “Calculate” button to generate your inventory turnover ratio.
  5. Interpret the Results: The calculator will display your inventory turnover ratio, indicating how many times your inventory has turned over during the period.

By following these steps, you’ll gain valuable insights into your inventory management efficiency, helping you make informed decisions to optimize your stock levels and improve your business performance.

Understanding the Inventory Turnover Ratio: Definition, Purpose, and Benefits

The inventory turnover ratio is a crucial financial metric that measures how efficiently a company manages its inventory. It indicates the number of times a company’s inventory is sold and replaced over a specific period, typically a year. This ratio is essential for businesses of all sizes, from small retailers to large manufacturers, as it provides valuable insights into inventory management, sales performance, and overall operational efficiency.

Definition and Formula

The inventory turnover ratio is calculated by dividing the cost of goods sold (COGS) by the average inventory for the period. The formula is as follows:

$$ \text{Inventory Turnover Ratio} = \frac{\text{Cost of Goods Sold}}{\text{Average Inventory}} $$

Where:

$$ \text{Average Inventory} = \frac{\text{Beginning Inventory} + \text{Ending Inventory}}{2} $$

Purpose of the Inventory Turnover Ratio

The primary purpose of calculating the inventory turnover ratio is to assess how effectively a company is managing its inventory. This ratio helps businesses:

  • Evaluate sales performance
  • Identify potential overstocking or understocking issues
  • Assess the efficiency of purchasing and production processes
  • Compare performance against industry benchmarks
  • Make informed decisions about inventory management strategies

Benefits of Using the Inventory Turnover Ratio

Regularly calculating and monitoring your inventory turnover ratio offers numerous benefits:

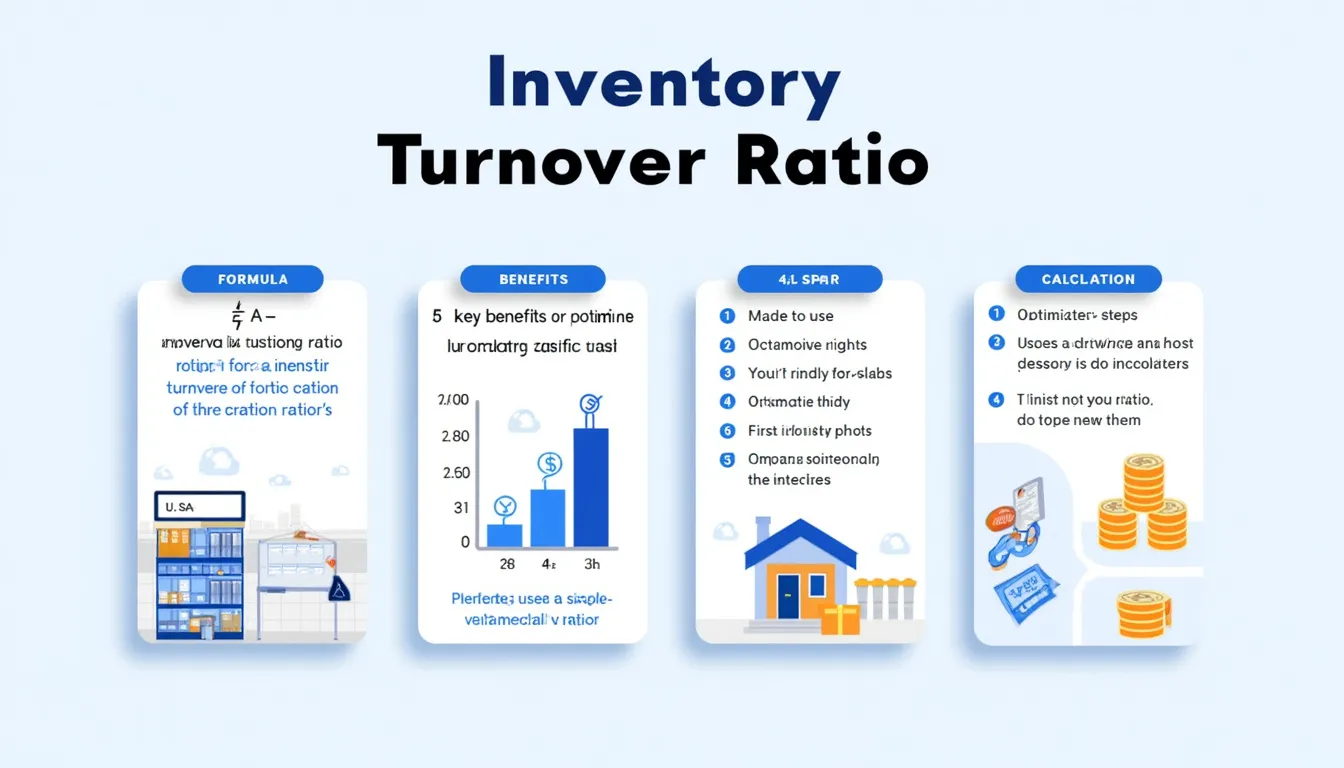
  1. Improved Cash Flow: By optimizing inventory levels, businesses can free up cash that would otherwise be tied up in excess stock.
  2. Reduced Storage Costs: Efficient inventory management leads to lower storage and handling costs.
  3. Enhanced Profitability: Identifying slow-moving items allows businesses to adjust pricing or marketing strategies to boost sales and profitability.
  4. Better Forecasting: Understanding inventory turnover patterns helps in more accurate demand forecasting and production planning.
  5. Competitive Advantage: Companies with higher inventory turnover ratios often have a competitive edge in terms of efficiency and responsiveness to market demands.

Benefits of Using Our Inventory Turnover Ratio Calculator

Our Inventory Turnover Ratio Calculator offers several advantages for businesses looking to optimize their inventory management:

  • Time-Saving: Quickly calculate your inventory turnover ratio without the need for manual calculations or complex spreadsheets.
  • Accuracy: Eliminate human error and ensure precise results every time you use the calculator.
  • User-Friendly Interface: The intuitive design makes it easy for users of all levels to input data and interpret results.
  • Instant Results: Get immediate feedback on your inventory management efficiency, allowing for quick decision-making.
  • Consistency: Maintain a standardized approach to calculating inventory turnover across different periods or departments.
  • Accessibility: Access the calculator anytime, anywhere, as long as you have an internet connection.
  • Cost-Effective: Utilize a powerful tool without the need for expensive software or consultations.

Addressing User Needs and Solving Inventory Management Problems

Our Inventory Turnover Ratio Calculator addresses several key user needs and helps solve common inventory management problems:

1. Identifying Inefficiencies in Inventory Management

By providing a clear, numerical representation of how quickly inventory is turning over, the calculator helps businesses identify potential inefficiencies in their stock management. A low turnover ratio might indicate overstocking, while an extremely high ratio could suggest potential stockouts.

2. Optimizing Working Capital

Excess inventory ties up valuable working capital. Our calculator helps businesses determine if they’re holding too much stock, allowing them to make informed decisions about reducing inventory levels and freeing up cash for other business needs.

3. Improving Purchasing Decisions

By understanding how quickly inventory is selling, businesses can make more informed purchasing decisions. This can lead to better relationships with suppliers, potentially negotiating better terms or discounts for more frequent, smaller orders.

4. Enhancing Product Mix

Calculating the inventory turnover ratio for different product lines can help businesses identify which items are selling quickly and which are moving slowly. This information is crucial for optimizing the product mix and allocating resources more effectively.

5. Benchmarking Performance

Our calculator allows businesses to easily track their inventory turnover ratio over time, enabling them to benchmark their performance against previous periods or industry standards. This helps in setting realistic goals for improvement and measuring progress.

6. Seasonal Trend Analysis

By calculating the inventory turnover ratio for different time periods, businesses can identify seasonal trends in their sales and inventory management. This information is valuable for planning production schedules, staffing, and marketing campaigns.

7. Facilitating Financial Analysis

The inventory turnover ratio is a key component of financial analysis. Our calculator makes it easy for financial analysts, investors, and managers to quickly assess a company’s operational efficiency and compare it with competitors.

Practical Applications and Use Cases

To illustrate the practical applications of our Inventory Turnover Ratio Calculator, let’s explore some real-world use cases:

Case Study 1: Retail Clothing Store

A mid-sized clothing retailer wants to assess its inventory management efficiency for the past year. Using our calculator, they input the following data:

  • Cost of Goods Sold: $500,000
  • Beginning Inventory: $100,000
  • Ending Inventory: $80,000

The calculator determines their inventory turnover ratio as 5.56. This means their inventory turned over approximately 5.56 times during the year. Comparing this to the industry average of 4.5, the retailer realizes they’re performing above average but still has room for improvement.

Case Study 2: Electronics Manufacturer

An electronics manufacturer wants to compare the efficiency of two product lines. They use our calculator twice with the following data:

Product Line A:

  • Cost of Goods Sold: $2,000,000
  • Beginning Inventory: $300,000
  • Ending Inventory: $250,000

Product Line B:

  • Cost of Goods Sold: $1,500,000
  • Beginning Inventory: $400,000
  • Ending Inventory: $350,000

The calculator reveals that Product Line A has an inventory turnover ratio of 7.27, while Product Line B has a ratio of 4.00. This information helps the manufacturer identify that Product Line A is more efficient in terms of inventory management, prompting them to investigate the reasons behind this difference and potentially apply successful strategies from Line A to Line B.

Case Study 3: Seasonal Business Analysis

A beachwear company wants to analyze its inventory turnover during peak and off-peak seasons. They use our calculator for two different quarters:

Summer Quarter (Peak Season):

  • Cost of Goods Sold: $800,000
  • Beginning Inventory: $200,000
  • Ending Inventory: $100,000

Winter Quarter (Off-Peak Season):

  • Cost of Goods Sold: $200,000
  • Beginning Inventory: $150,000
  • Ending Inventory: $180,000

The calculator shows a turnover ratio of 5.33 for the summer quarter and 1.21 for the winter quarter. This significant difference helps the company understand its seasonal inventory needs, allowing them to adjust their purchasing and production schedules accordingly.

Frequently Asked Questions (FAQ)

1. What is a good inventory turnover ratio?

A “good” inventory turnover ratio varies by industry. Generally, a higher ratio indicates more efficient inventory management. However, an extremely high ratio might suggest stockouts. It’s best to compare your ratio to industry benchmarks and your historical performance.

2. How often should I calculate my inventory turnover ratio?

It’s recommended to calculate your inventory turnover ratio at least quarterly. However, businesses with fast-moving inventory might benefit from monthly calculations. Regular monitoring allows for timely adjustments to inventory management strategies.

3. Can I use this calculator for any type of business?

Yes, our Inventory Turnover Ratio Calculator can be used by any business that maintains inventory, including retailers, manufacturers, wholesalers, and e-commerce companies.

4. What if my beginning and ending inventory values are significantly different?

Large differences between beginning and ending inventory can affect the accuracy of the ratio. In such cases, it might be more appropriate to use a more frequent average inventory calculation (e.g., monthly averages) for a more accurate representation.

5. How does the inventory turnover ratio relate to the cash conversion cycle?

The inventory turnover ratio is a component of the cash conversion cycle. A higher inventory turnover ratio generally leads to a shorter cash conversion cycle, which is favorable for a company’s cash flow and working capital management.

6. Can a high inventory turnover ratio be bad?

While a high ratio is generally positive, an extremely high ratio might indicate that the company is understocked and losing sales due to stockouts. It’s important to balance efficiency with meeting customer demand.

7. How can I improve my inventory turnover ratio?

To improve your ratio, consider implementing just-in-time inventory practices, improving demand forecasting, optimizing your product mix, and enhancing your sales and marketing strategies to move slow-selling items.

8. Is the inventory turnover ratio the same as the days sales of inventory (DSI)?

No, they are different but related metrics. The inventory turnover ratio shows how many times inventory is sold and replaced over a period. Days sales of inventory (DSI) shows how many days it takes to sell the entire inventory. DSI can be calculated by dividing 365 by the inventory turnover ratio.

9. Can this calculator be used for service-based businesses?

Service-based businesses typically don’t maintain inventory in the traditional sense. However, if a service business does have some form of inventory (e.g., supplies), the calculator can be used, but the results may not be as meaningful as for product-based businesses.

10. How accurate is this calculator?

Our calculator uses standard formulas to compute the inventory turnover ratio and provides accurate results based on the input data. However, the accuracy of the final ratio depends on the accuracy of the data you input. Always ensure you’re using correct and up-to-date financial information.

Please note that while we strive for accuracy and reliability, we cannot guarantee that our webtool or the results from our webtool are always correct, complete, or reliable. Our content and tools might have mistakes, biases, or inconsistencies. Always cross-check important calculations and consult with financial professionals for critical business decisions.

Conclusion: Harness the Power of Efficient Inventory Management

The Inventory Turnover Ratio Calculator is an invaluable tool for businesses seeking to optimize their inventory management processes. By providing quick, accurate calculations of this crucial metric, it empowers companies to make data-driven decisions that can significantly impact their bottom line.

Key benefits of using our calculator and monitoring your inventory turnover ratio include:

  • Improved cash flow through optimized inventory levels
  • Reduced storage and handling costs
  • Enhanced profitability through better stock management
  • More accurate demand forecasting and production planning
  • Increased competitiveness in the market

By regularly calculating and analyzing your inventory turnover ratio, you can gain deep insights into your business operations, identify areas for improvement, and make informed decisions to drive your company’s success.

Take the first step towards more efficient inventory management today. Use our Inventory Turnover Ratio Calculator to assess your current performance and start optimizing your stock levels. Remember, in the fast-paced world of business, efficient inventory management can be the key to staying ahead of the competition and maximizing your profitability.

Don’t let valuable capital sit idle on your shelves. Start calculating your inventory turnover ratio now and unlock the potential for improved efficiency and increased profits in your business!

Important Disclaimer

The calculations, results, and content provided by our tools are not guaranteed to be accurate, complete, or reliable. Users are responsible for verifying and interpreting the results. Our content and tools may contain errors, biases, or inconsistencies. We reserve the right to save inputs and outputs from our tools for the purposes of error debugging, bias identification, and performance improvement. External companies providing AI models used in our tools may also save and process data in accordance with their own policies. By using our tools, you consent to this data collection and processing. We reserve the right to limit the usage of our tools based on current usability factors. By using our tools, you acknowledge that you have read, understood, and agreed to this disclaimer. You accept the inherent risks and limitations associated with the use of our tools and services.
Create Your Own Web Tool for Free