Use our IPO Underpricing Calculator to measure the performance of initial public offerings by calculating first-day returns and comparing them against industry benchmarks. Perfect for investors, analysts, and financial professionals seeking to evaluate offering efficiency and price performance.
IPO Underpricing Analyzer
Results
First-Day Return:
Industry Average Benchmark:
14.0%
★ Add to Home Screen
×
Follow these steps:
Tap the Share button at the bottom of the browser
Scroll down and tap “Add to Home Screen”
Tap “Add” to confirm
Follow these steps:
Tap the menu icon (⋮) in the top right
Tap “Add to Home screen”
Tap “Add” to confirm
Follow these steps:
Click the menu icon (⋮) in the top right
Click “Bookmarks”
Click “Bookmark this tab” or press Ctrl+D (Cmd+D on Mac)
Is this tool helpful?
Thanks for your feedback!
How to Use the IPO Underpricing Analyzer Effectively
To analyze IPO underpricing using this calculator, follow these simple steps:
Enter the IPO Offer Price: Input the initial offering price set by the company. For example, if a company sets its IPO price at $35.50 per share, enter this value in the first field.
Input the First-Day Close Price: Enter the stock’s closing price at the end of its first trading day. For instance, if the stock closed at $45.75, enter this amount in the second field.
Click “Calculate Underpricing” to view your results.
Understanding IPO Underpricing
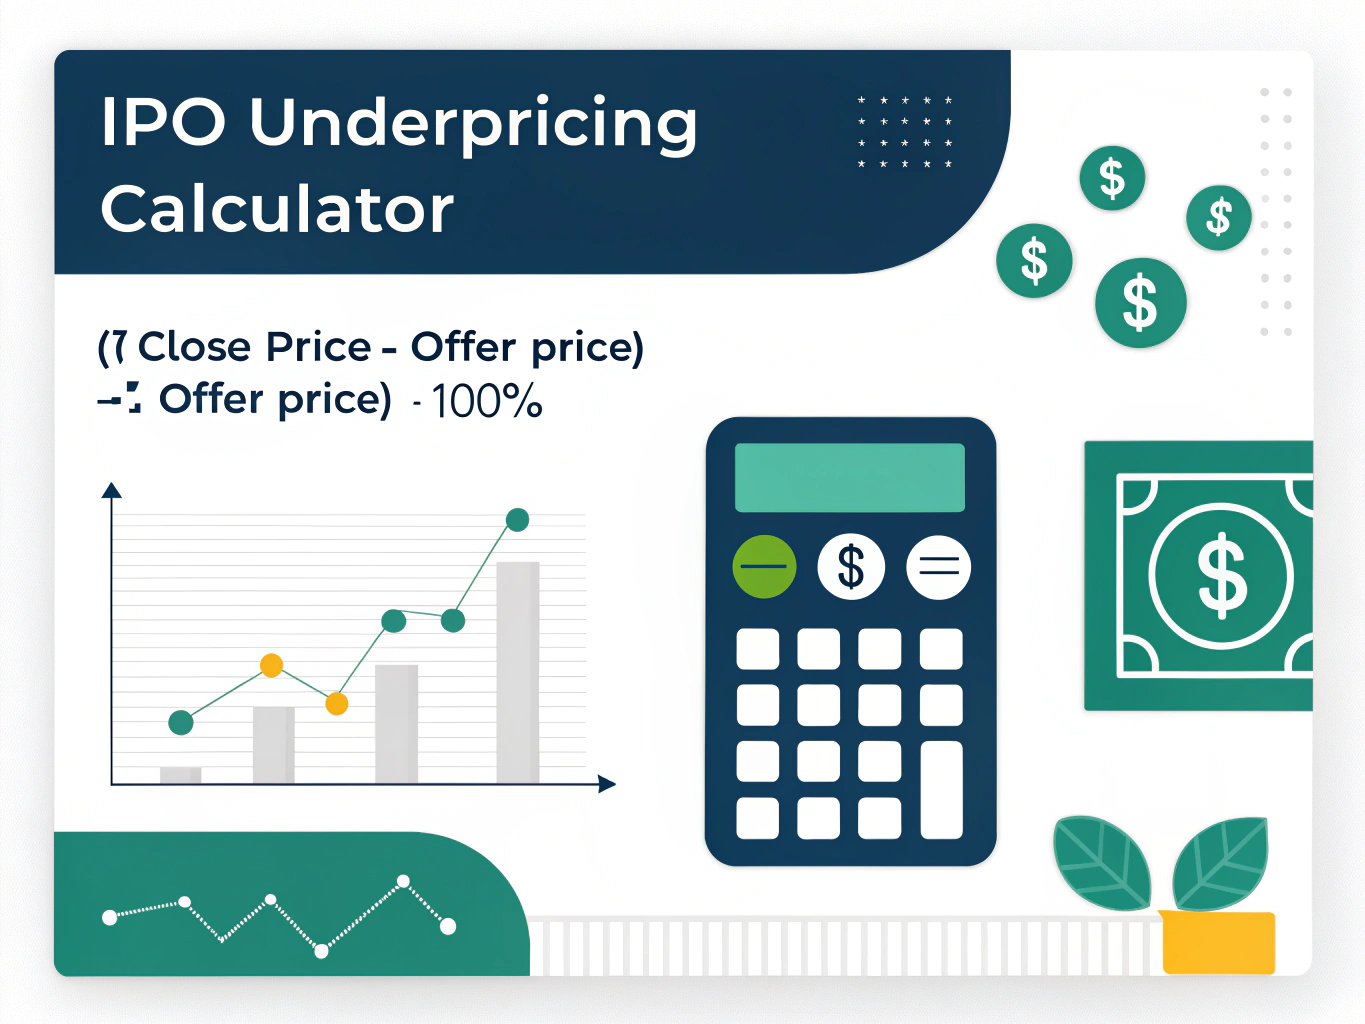
IPO underpricing refers to the phenomenon where a company’s shares trade significantly higher than their initial offering price on the first day of trading. The mathematical formula for calculating underpricing is:
The tool includes industry average benchmarking of 14.0%, allowing users to:
Compare specific IPO performance against market norms
Identify unusual pricing patterns
Assess market conditions
Evaluate pricing efficiency
Best Practices for Analysis
To maximize the tool’s effectiveness:
Compare results across similar sector IPOs
Consider market conditions and timing
Analyze trends over multiple IPOs
Include broader market context in analysis
Frequently Asked Questions
What is a typical range for IPO underpricing?
While underpricing varies significantly, historical averages typically range from 10% to 20% across different markets and sectors.
How does underpricing benefit different stakeholders?
Underpricing can benefit institutional investors through initial returns, while companies might use it to ensure successful offerings and generate market interest.
When should I use this calculator?
Use the calculator when evaluating IPO performance, planning IPO investments, or analyzing historical IPO data for market research.
Can underpricing vary by industry?
Yes, different sectors often show varying levels of underpricing, with technology and biotech sectors historically showing higher average underpricing.
How does market condition affect underpricing?
Market conditions significantly influence underpricing levels, with bull markets typically showing higher underpricing than bear markets.
What role do underwriters play in IPO pricing?
Underwriters help determine the initial offering price based on market conditions, company fundamentals, and investor demand during the book-building process.
Advanced Analysis Considerations
When using the calculator, consider these additional factors:
Market volatility and timing
Sector-specific trends
Company size and age
Overall market sentiment
Comparable company performances
Supporting Decision Making
The analyzer supports various decisions:
IPO participation strategies
Portfolio allocation decisions
Market timing considerations
Risk assessment evaluations
Important Disclaimer
The calculations, results, and content provided by our tools are not guaranteed to be accurate, complete, or reliable. Users are responsible for verifying and interpreting the results. Our content and tools may contain errors, biases, or inconsistencies. We reserve the right to save inputs and outputs from our tools for the purposes of error debugging, bias identification, and performance improvement. External companies providing AI models used in our tools may also save and process data in accordance with their own policies. By using our tools, you consent to this data collection and processing. We reserve the right to limit the usage of our tools based on current usability factors. By using our tools, you acknowledge that you have read, understood, and agreed to this disclaimer. You accept the inherent risks and limitations associated with the use of our tools and services.