Is this tool helpful?
How to Use the Knowledge Graph Generator Tool Effectively
You can create visual maps of ideas and their relationships with this Knowledge Graph Generator. Follow these simple steps to build clear, organized knowledge graphs:
- Main topic or concept: Enter the central idea that anchors your graph. For example, “Renewable Energy” or “Modern Philosophy”.
- Primary components: List key sub-topics separated by commas. Examples include “Solar Power, Wind Energy, Bioenergy” or “Existentialism, Rationalism, Empiricism”.
- Relationship types: Define how nodes connect, such as “enables,” “contrasts with,” “builds upon”. This field is optional but improves clarity.
- Graph purpose: Select your graph’s primary use, like Scientific Research, Corporate Knowledge, or Learning Curriculum.
What Is the Knowledge Graph Generator and Why Use It?
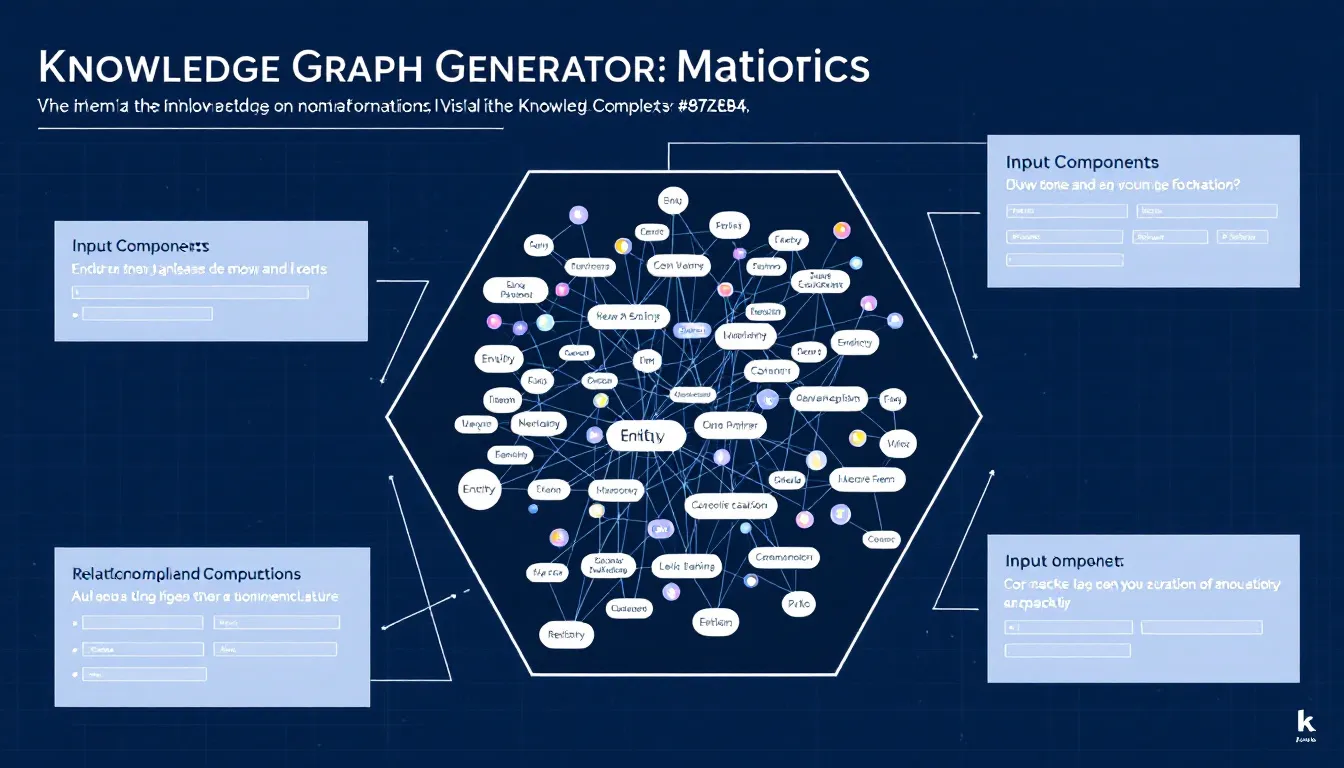
The Knowledge Graph Generator helps you organize complex information by creating structured, interactive visual maps. These maps reveal how ideas, concepts, or entities connect, making it easier for you to explore, learn, and communicate information.
Key Benefits of Using the Knowledge Graph Generator
- Clear visualization: Show relationships between ideas to improve understanding.
- Organized structure: Break down topics into components and sub-components neatly.
- Interactive exploration: Dive into specific areas of your graph with ease.
- Improved memory retention: Visual aids help you remember complex subjects better.
- Supports various goals: Use it for research, corporate knowledge sharing, or educational planning.
Mathematical Foundation Behind Knowledge Graphs
Knowledge graphs are based on graph theory. They consist of nodes (vertices) and edges that represent relationships. The formal structure follows these rules:
$$G = (V, E)$$$$E = \{(u, v) \mid u, v \in V\}$$$$w(u, v) = \text{strength of relationship between nodes } u \text{ and } v$$This mathematical basis allows graphs to model complex networks in an understandable, visual format.
Practical Applications of the Knowledge Graph Generator Tool
Research Project Organization
Use the generator to structure research topics and their relationships. For example, organizing studies on Artificial Intelligence Ethics:
- Root Node: Artificial Intelligence Ethics
- Primary Components: Bias Mitigation, Privacy, Algorithm Transparency
- Secondary Nodes:
- Bias Mitigation → Data Auditing, Fairness Metrics
- Privacy → Data Encryption, User Consent
- Algorithm Transparency → Explainability, Accountability
Corporate Knowledge Management
Map your company’s structure and departments clearly. For example, a software firm’s core layout:
- Root Node: Innovative Software Ltd.
- Primary Components: Development, Quality Assurance, Sales
- Relationships:
- Development → Quality Assurance (Code Testing)
- Sales → Development (Feature Requests)
- Quality Assurance → Sales (Bug Reports)
Educational Content Structure
Design clear study guides and learning paths that include prerequisite skills and topics. For instance:
- Root Node: Introduction to Environmental Science
- Primary Components: Ecology, Pollution, Climate Change
- Sample Relationships: Ecology → Pollution (Cause-Effect), Climate Change → Ecology (Impact)
Common Use Cases for Knowledge Graphs
Academic Research and Theory Mapping
- Organize literature reviews
- Map hypotheses and their interrelations
- Document methodologies
- Structure research findings and conclusions
Business Workflow Visualization
- Illustrate department roles and interactions
- Track project dependencies
- Visualize resource distribution
- Improve communication channels
Curriculum and Skill Path Design
- Plan course sequences
- Define prerequisites
- Map skill development progressions
- Build assessment frameworks
Frequently Asked Questions About the Knowledge Graph Generator
How do I begin creating my first knowledge graph?
Start with a clear central topic. Break it down into 3-5 main components and add connections with meaningful relationship types. Expand gradually to maintain clarity.
Can I update my knowledge graph after creating it?
Yes, knowledge graphs are flexible and can be modified as your understanding or needs evolve.
How should I organize complex hierarchical information?
Arrange broader categories at the top level, then divide them into specific subcategories. Use clear relationship labels to show how elements relate.
What kinds of relationship types work best?
Use terms that directly describe connections like “depends on,” “leads to,” “includes,” or “influences.” Consistent naming enhances readability and understanding.
What is the ideal number of nodes for a manageable graph?
Start with 10-15 nodes focusing on key concepts. You can extend the graph over time while keeping the structure clear.
How can I use the knowledge graph for team collaboration?
Share the graph with your team to ensure shared understanding, identify linkages across expertise areas, and facilitate knowledge transfer.
What are best practices for naming nodes?
Choose clear, concise terms that accurately describe each concept. Avoid vague or confusing labels and maintain consistency throughout.
How can I represent different relationship types visually?
Use different colors, line styles, or labels to distinguish relationship types. This adds clarity and helps viewers quickly recognize how nodes interact.
Important Disclaimer
The calculations, results, and content provided by our tools are not guaranteed to be accurate, complete, or reliable. Users are responsible for verifying and interpreting the results. Our content and tools may contain errors, biases, or inconsistencies. Do not enter personal data, sensitive information, or personally identifiable information in our web forms or tools. Such data entry violates our terms of service and may result in unauthorized disclosure to third parties. We reserve the right to save inputs and outputs from our tools for the purposes of error debugging, bias identification, and performance improvement. External companies providing AI models used in our tools may also save and process data in accordance with their own policies. By using our tools, you consent to this data collection and processing. We reserve the right to limit the usage of our tools based on current usability factors.
