Use our comprehensive LBO Calculator to evaluate potential leveraged buyout investments. Input purchase price, equity contribution, exit multiple, and holding period to instantly calculate IRR, equity multiple, and total returns. Essential tool for private equity professionals, investment bankers, and financial analysts.
LBO Analysis Calculator
LBO Analysis Results
★ Add to Home Screen
×
Follow these steps:
Tap the Share button at the bottom of the browser
Scroll down and tap “Add to Home Screen”
Tap “Add” to confirm
Follow these steps:
Tap the menu icon (⋮) in the top right
Tap “Add to Home screen”
Tap “Add” to confirm
Follow these steps:
Click the menu icon (⋮) in the top right
Click “Bookmarks”
Click “Bookmark this tab” or press Ctrl+D (Cmd+D on Mac)
Is this tool helpful?
Thanks for your feedback!
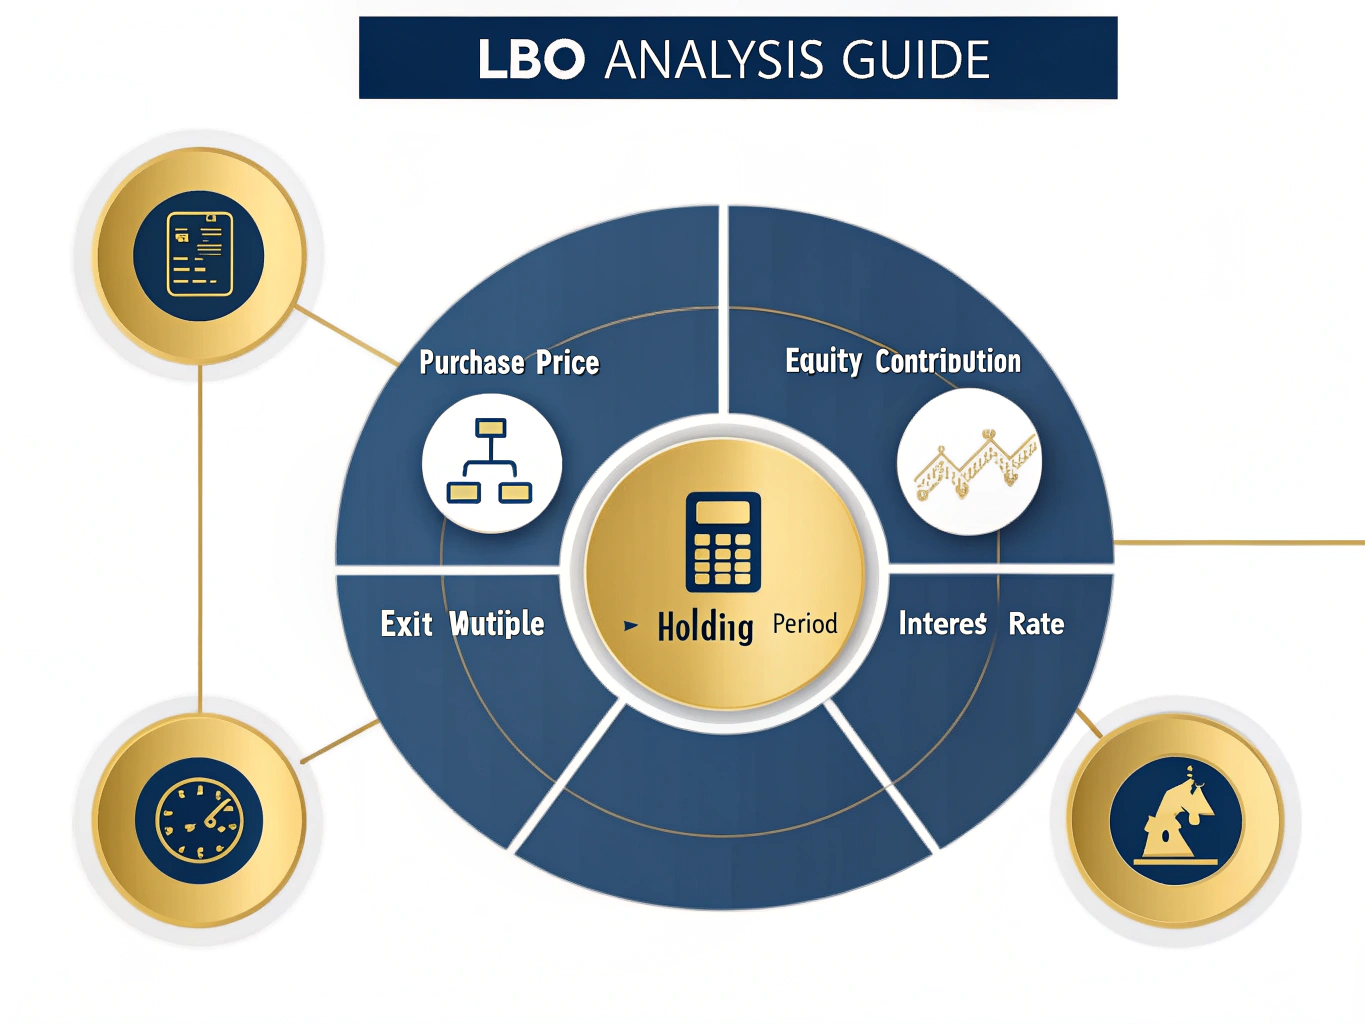
How to Use the LBO Analysis Calculator Effectively
This Leveraged Buyout (LBO) Analysis Calculator is designed to help investors and financial professionals evaluate potential returns from debt-financed acquisitions. Here’s a detailed guide on using each field:
Input Fields Guide
Purchase Price ($): Enter the total acquisition cost. For example, $25,000,000 for a mid-sized manufacturing company or $75,000,000 for a retail chain.
Equity Contribution ($): Input the amount of equity investment. This could be $7,500,000 (30%) for the manufacturing company or $18,750,000 (25%) for the retail chain.
Exit Multiple: Input the expected multiple of the initial investment at sale. Common values range from 1.5 to 4.0, depending on industry and growth prospects.
Holding Period (Years): Specify the investment timeframe, typically between 3-7 years.
Interest Rate (%): Enter the annual interest rate on the debt portion. Market rates typically range from 6% to 12%.
Understanding Leveraged Buyout Analysis
A leveraged buyout analysis calculator is an essential tool for private equity professionals, investment bankers, and corporate finance specialists who need to evaluate potential returns from debt-financed acquisitions. The calculator combines the principles of debt financing, equity investment, and time value of money to project potential returns.
Mathematical Foundation
The core calculation revolves around the Internal Rate of Return (IRR), which is represented by the following formula:
$$
\text{IRR} = r \text{ where } \sum_{t=0}^{n} \frac{CF_t}{(1 + r)^t} = 0
$$
Where:
CF_t represents cash flows at time t
r is the internal rate of return
n is the holding period
Benefits of Using the LBO Analysis Calculator
Time Efficiency: Instantly calculate complex IRR and equity multiple metrics
Scenario Analysis: Quickly evaluate multiple investment scenarios by adjusting variables
Risk Assessment: Better understand the impact of leverage on potential returns
Investment Decision Support: Make data-driven decisions about acquisition opportunities
Strategic Planning: Optimize capital structure and exit timing
Solving Real-World Investment Challenges
The LBO Analysis Calculator addresses several key challenges faced by investors:
Capital Structure Optimization
Consider a $50 million acquisition with two potential capital structures:
The calculator helps optimize exit timing by comparing returns across different holding periods. For example:
3-year hold with 2.5x multiple
5-year hold with 3.0x multiple
7-year hold with 3.5x multiple
Practical Applications and Case Studies
Manufacturing Industry Example
Manufacturing Company XYZ:
Purchase Price: $40 million
Equity Contribution: $12 million
Exit Multiple: 2.8x
Holding Period: 4 years
Interest Rate: 7.5%
Technology Sector Example
Software Company ABC:
Purchase Price: $100 million
Equity Contribution: $35 million
Exit Multiple: 3.5x
Holding Period: 5 years
Interest Rate: 8.5%
Frequently Asked Questions
What is an exit multiple?
The exit multiple represents the factor by which the initial investment is expected to grow at sale. For example, a 2.5x multiple means the business is expected to sell for 2.5 times the purchase price.
How does the holding period affect returns?
Longer holding periods typically allow for more operational improvements and value creation but may reduce IRR due to the time value of money. The optimal holding period depends on industry dynamics and value creation opportunities.
What is a good IRR for an LBO investment?
Target IRRs vary by industry, risk profile, and market conditions. Generally, private equity firms target IRRs of 20-25% or higher for their investments.
How does the interest rate impact returns?
Higher interest rates increase debt service costs and reduce cash available for equity holders. A 1% increase in interest rates can significantly impact overall returns, especially in highly leveraged transactions.
Should the equity contribution be maximized or minimized?
The optimal equity contribution depends on multiple factors including: industry stability, cash flow predictability, and debt service capacity. Higher leverage can increase equity returns but also increases risk.
Advanced Considerations in LBO Analysis
Industry-Specific Factors
Different industries require different approaches to LBO analysis:
Cyclical industries may require lower leverage ratios
High-growth sectors might support higher multiples
Asset-heavy industries often allow for higher leverage
Always conduct sensitivity analysis across multiple variables:
Exit multiple ranges
Interest rate scenarios
Operating performance variations
Holding period adjustments
Risk Assessment
Consider key risk factors in your analysis:
Market risk factors
Operating leverage impact
Financial leverage effects
Exit environment scenarios
Important Disclaimer
The calculations, results, and content provided by our tools are not guaranteed to be accurate, complete, or reliable. Users are responsible for verifying and interpreting the results. Our content and tools may contain errors, biases, or inconsistencies. We reserve the right to save inputs and outputs from our tools for the purposes of error debugging, bias identification, and performance improvement. External companies providing AI models used in our tools may also save and process data in accordance with their own policies. By using our tools, you consent to this data collection and processing. We reserve the right to limit the usage of our tools based on current usability factors. By using our tools, you acknowledge that you have read, understood, and agreed to this disclaimer. You accept the inherent risks and limitations associated with the use of our tools and services.


 Retirement Calculator: Estimate Your Future Savings")