Is this tool helpful?
How to use the tool
- Product / Service. Type the exact offer you will promote.
Example 1: “EcoCharge Portable Solar Bank”
Example 2: “ProChef Virtual Cooking Class”. - Specific problem or opportunity. Name a focused issue the campaign must fix.
Example 1: “Subscriber churn after free trial”
Example 2: “Low add-to-cart rate on mobile”. - Key metrics and data sources. List numbers and tools you will track.
Example 1: “Trial-to-paid rate, Mixpanel funnel”
Example 2: “Cart starts, GA4 events, Hotjar heat-maps”. - Iteration / experimentation approach. Describe how you will test.
Example 1: “Weekly A/B email tests”
Example 2: “Usability interviews + rapid landing-page tweaks”. - Specific tactics. Bullet the actions you will run.
Example 1: “TikTok ads, influencer unboxings”
Example 2: “SEO pillar posts, retargeting banners”. - Success metrics. Enter the numbers that define winning.
Example 1: “+15 % revenue per user”
Example 2: “-25 % checkout drop-off”. - Submit & copy. Click “Generate Marketing Campaign Outline,” review the draft, then hit “Copy to Clipboard” for easy sharing.
Quick-Facts
- SaaS median customer-acquisition cost: $205 (KeyBanc Capital Markets SaaS Survey 2023).
- Winning A/B tests run at least 2 weeks to reach 95 % significance (Optimizely, 2023).
- Average e-commerce conversion rate: 2.5 %-3 % (Klaviyo Benchmark Report 2022).
- Marketers using iterative testing lift ROI by 30 % (McKinsey Digital, 2021).
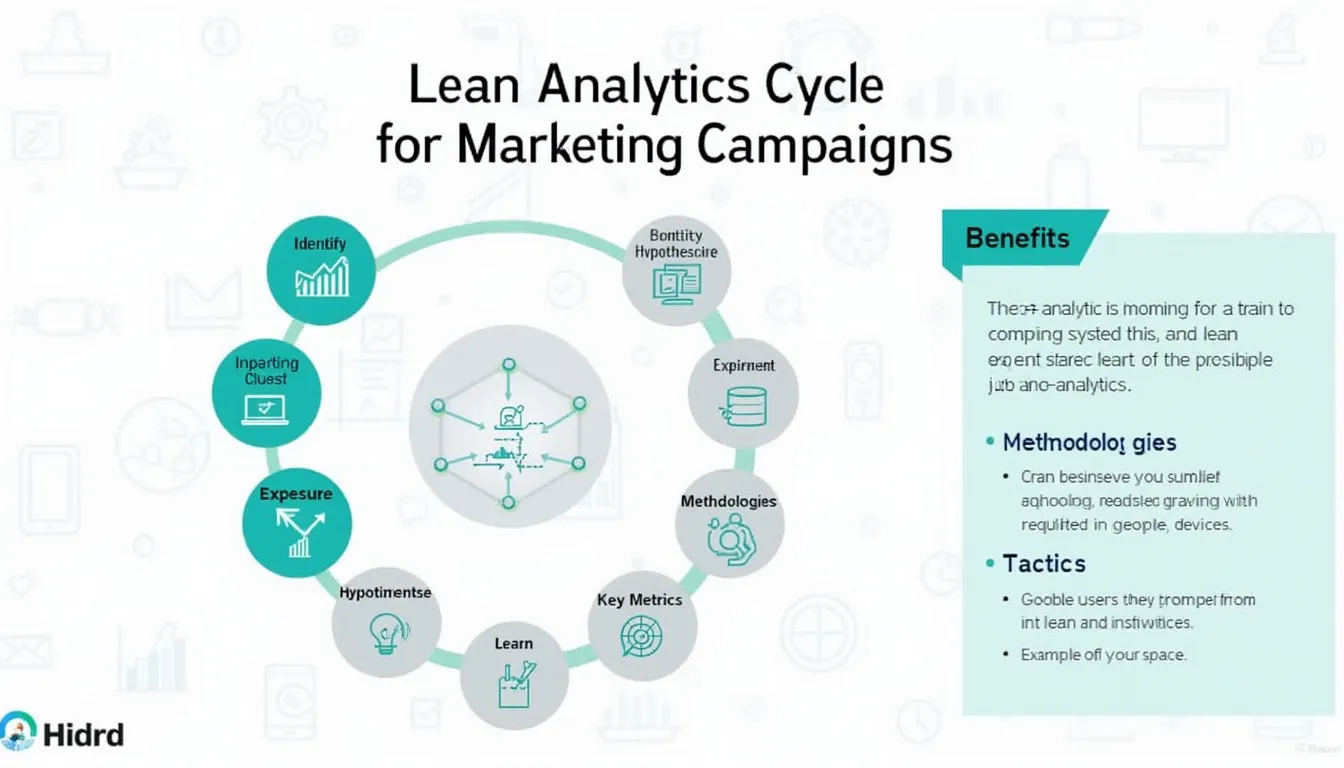
Why the Lean Analytics Cycle works
The framework forces you to bet small, learn fast, and scale only what the data proves effective (Croll & Yoskovitz, 2013).
The five-step loop
- Identify. Pinpoint one growth blocker.
- Hypothesize. State what might remove it.
- Experiment. Design a minimal, measurable test.
- Measure. Track leading indicators, not vanity stats.
- Learn & iterate. Keep, kill or pivot the tactic.
Real-world examples
- Fintech onboarding. Problem: 40 % form abandonment. Metric: completion rate. Test: shorter KYC flow. Tactic: progress bar. Goal: +20 % completions.
- Local gym membership drive. Opportunity: New-year surge. Metric: sign-ups/week. Test: referral vs. free-trial offers. Tactic: SMS + QR posters. Goal: 300 new members in 60 days.
Key benefits
- Evidence-based decisions. You invest where numbers justify it.
- Agility. Weekly loops outrun quarterly plans.
- Resource focus. One hypothesis at a time prevents waste.
- Team alignment. Shared metrics give marketing, product and sales a common scoreboard.
FAQ
What problem does the tool solve?
It turns scattered ideas into a single, testable marketing plan aligned with Lean Analytics principles (Croll & Yoskovitz, 2013).
Which metrics should I track first?
Choose one leading indicator tied to revenue—e.g., qualified leads or activation rate—because leading metrics predict growth sooner (Reforge Growth Models, 2022).
How big should my first experiment be?
Limit scope so you can gather actionable data within two weeks and under 10 % of the monthly budget (Optimizely, 2023).
Can non-technical teams use the tool?
Yes; the form requires plain-language inputs and the output explains tactics without code, letting any marketer iterate quickly.
How often do I revisit the outline?
Update after every experiment cycle or at least monthly to keep assumptions current with market shifts (McKinsey Digital, 2021).
Does it replace my analytics platform?
No. It structures your hypotheses; you still collect raw data in GA4, Amplitude or similar dashboards for validation.
What’s a good success metric increase to target?
Aim for 10 %-20 % uplift; smaller gains can be noise, while larger targets risk unrealistic expectations (Klaviyo 2022 benchmarks).
How do I share results with stakeholders?
Use the “Copy to Clipboard” button, paste the outline into Slides or Notion, then attach live metric screenshots for proof.
Important Disclaimer
The calculations, results, and content provided by our tools are not guaranteed to be accurate, complete, or reliable. Users are responsible for verifying and interpreting the results. Our content and tools may contain errors, biases, or inconsistencies. Do not enter personal data, sensitive information, or personally identifiable information in our web forms or tools. Such data entry violates our terms of service and may result in unauthorized disclosure to third parties. We reserve the right to save inputs and outputs from our tools for the purposes of error debugging, bias identification, and performance improvement. External companies providing AI models used in our tools may also save and process data in accordance with their own policies. By using our tools, you consent to this data collection and processing. We reserve the right to limit the usage of our tools based on current usability factors.