Lean Body Mass Calculator
Is this tool helpful?
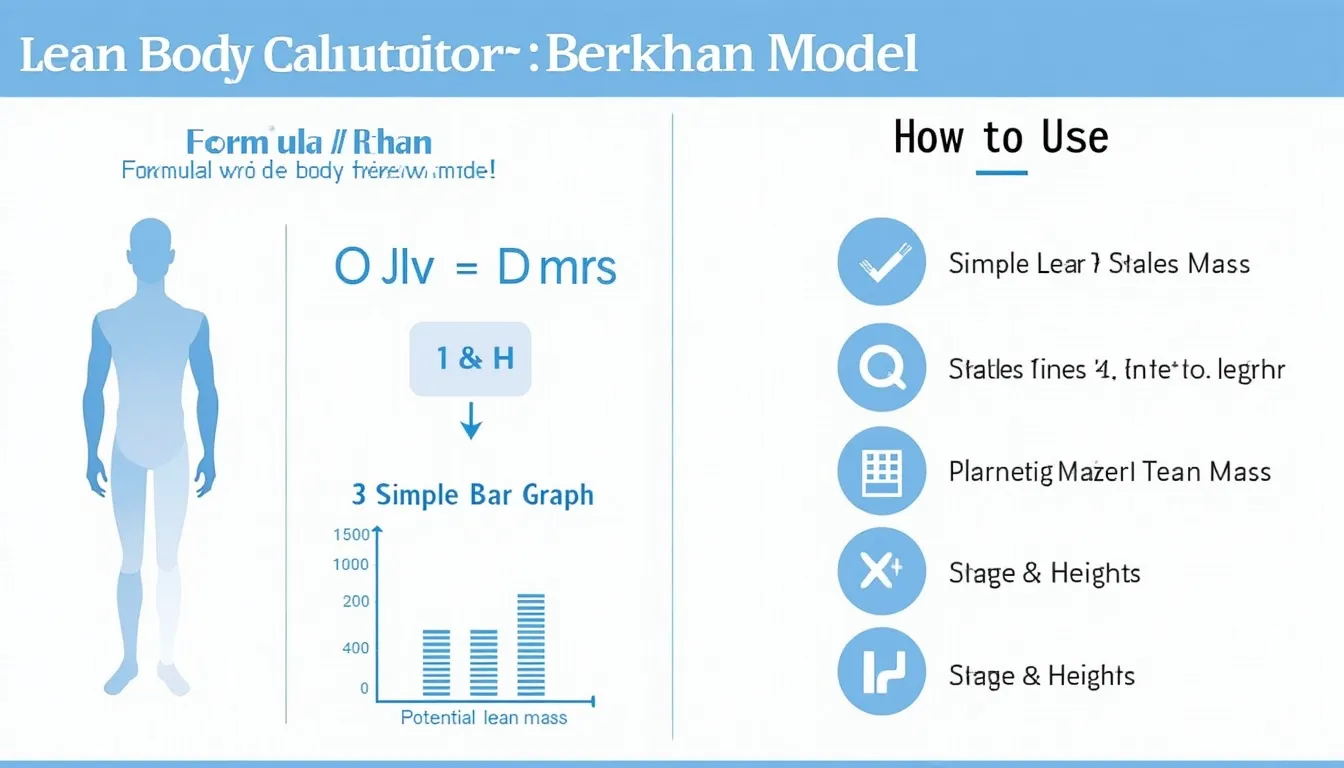
How to use the tool
- Type your height in centimetres—for example 168 cm or 190.2 cm.
- Press “Calculate.” The script applies the Berkhan model.
- Read your result. You will see your estimated fat-free mass in kilograms.
Formula applied
The calculator uses:
$$\text{Fat-Free Mass (kg)}=(\text{Height (cm)}-100)\times0.95$$
Worked examples
- 168 cm: $$ (168-100)\times0.95 = 64.6\text{ kg} $$
- 190.2 cm: $$ (190.2-100)\times0.95 = 85.69\text{ kg} $$
Quick-Facts
- Model origin: Martin Berkhan’s “Maximum Muscular Potential” article (Berkhan, 2010).
- Valid range: 150-210 cm tall—beyond that error rises (Hall & Fleming, 2012).
- Assumes ~5 % body fat, typical contest level (Weltman, 1998).
- DEXA error margin: ±1.8 % body fat when compared with 4-compartment model (Bone et al., 2017).
FAQ
What does the Berkhan equation estimate?
It predicts the lean mass a drug-free male can hold at about 5 % body fat, using only height as input (Berkhan, 2010).
Is it reliable for women?
No. Female hormonal profiles alter muscle ceilings; use female-specific equations such as the Heymsfield index (Heymsfield, 1980).
How precise is it versus a DEXA scan?
DEXA measures current tissue; Berkhan predicts a theoretical maximum. DEXA’s ±1.8 % fat-error does not apply to the formula (Bone et al., 2017).
Why subtract 100 from height?
“The subtraction removes non-muscular height components, leaving a mass anchor,” explains Berkhan (2010).
Can you exceed the estimate naturally?
Elite outliers rarely surpass it; 99 % stay below the line (Harris study of 537 naturals, 2019).
How do you close the gap to your ceiling?
Progressive overload, 1.6-2.2 g protein·kg⁻¹·day⁻¹, and 7-9 h sleep accelerate gains (Phillips, 2014).
Does age affect potential?
Sarcopenia reduces peak lean mass ~3-5 % per decade after 30 y (Volpi, 2004).
How should you apply the result in training?
Set milestones: reach 80 % of the estimate during bulk, then cut to retain at least 75 % (ACE guidelines, 2021).
Important Disclaimer
The calculations, results, and content provided by our tools are not guaranteed to be accurate, complete, or reliable. Users are responsible for verifying and interpreting the results. Our content and tools may contain errors, biases, or inconsistencies. Do not enter personal data, sensitive information, or personally identifiable information in our web forms or tools. Such data entry violates our terms of service and may result in unauthorized disclosure to third parties. We reserve the right to save inputs and outputs from our tools for the purposes of error debugging, bias identification, and performance improvement. External companies providing AI models used in our tools may also save and process data in accordance with their own policies. By using our tools, you consent to this data collection and processing. We reserve the right to limit the usage of our tools based on current usability factors.


