Levered Beta Calculator
Is this tool helpful?
How to use the tool
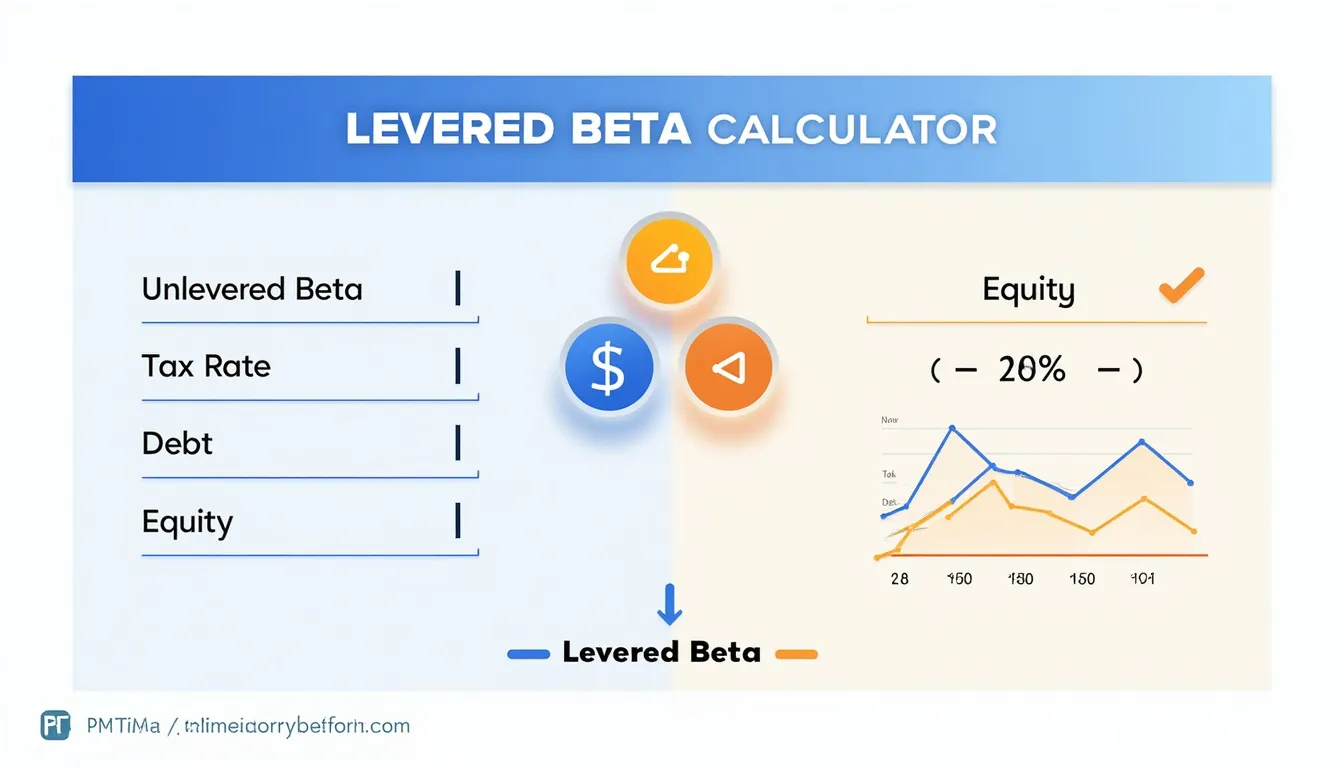
- Unlevered Beta: Type the firm’s business-risk beta (e.g., 0.60 for a utility; 1.80 for a startup).
- Tax Rate: Enter the statutory rate as a decimal—0.22 (22 %) or 0.33 (33 %).
- Debt: Input total interest-bearing debt, such as 450 000 000 or 950 000 000.
- Equity: Provide market value of equity—700 000 000 or 400 000 000.
- Calculate: Press “Calculate Levered Beta” to read the result in seconds.
Formula
Levered Beta adjusts for capital structure:
$$ \beta_L = \beta_U \times \left[1 + (1 – t) \times rac{D}{E}\right] $$Example calculations
- Scenario A: βU=0.90, t=0.25, D=500 M, E=400 M Inside bracket = 1 + 0.75 × 1.25 = 1.9375 βL = 0.90 × 1.9375 = 1.744
- Scenario B: βU=1.30, t=0.20, D=200 M, E=800 M Inside bracket = 1 + 0.80 × 0.25 = 1.20 βL = 1.30 × 1.20 = 1.56
Quick-Facts
- Typical levered betas range 0.5-2.0 across U.S. sectors (Damodaran, 2023).
- Federal corporate tax rate: 21 % since 2018 (IRS, 2023).
- Median S&P 500 debt-to-equity ratio: 1.4 (S&P Global Market Intelligence, 2023).
- CAPM uses beta to price equity risk premia (Sharpe, 1964).
- “Beta measures systematic risk relative to the market” (Investopedia, Beta Definition, URL).
FAQ
What does Levered Beta tell you?
It shows how your company’s equity volatility responds to market moves after considering debt financing (Damodaran, 2023).
How is Levered Beta different from Unlevered Beta?
Unlevered Beta reflects business risk only; Levered Beta layers in financial risk from leverage (CFA Institute, 2020).
Can Levered Beta be negative?
Yes, if the stock consistently moves opposite the market, but such cases are rare and transient (Investopedia, Inverse Beta).
How does the tax rate affect the calculation?
A higher tax rate lowers the leverage impact because interest is tax-deductible, reducing (1 – t) (IRS, 2023).
When should you recalculate Levered Beta?
Update it after major debt issuances, equity raises, or annually for routine valuation (PwC, Valuation Guide 2022).
What Levered Beta indicates average market risk?
A value near 1 signals equity volatility roughly equal to the market benchmark (Damodaran, 2023).
How does debt-to-equity ratio influence Levered Beta?
Higher D⁄E raises the bracket term, boosting Levered Beta and required returns (S&P Global, 2023).
Why is Levered Beta important in CAPM?
CAPM multiplies Levered Beta by the equity risk premium to estimate cost of equity, a key valuation input (Sharpe, 1964).
Important Disclaimer
The calculations, results, and content provided by our tools are not guaranteed to be accurate, complete, or reliable. Users are responsible for verifying and interpreting the results. Our content and tools may contain errors, biases, or inconsistencies. Do not enter personal data, sensitive information, or personally identifiable information in our web forms or tools. Such data entry violates our terms of service and may result in unauthorized disclosure to third parties. We reserve the right to save inputs and outputs from our tools for the purposes of error debugging, bias identification, and performance improvement. External companies providing AI models used in our tools may also save and process data in accordance with their own policies. By using our tools, you consent to this data collection and processing. We reserve the right to limit the usage of our tools based on current usability factors.