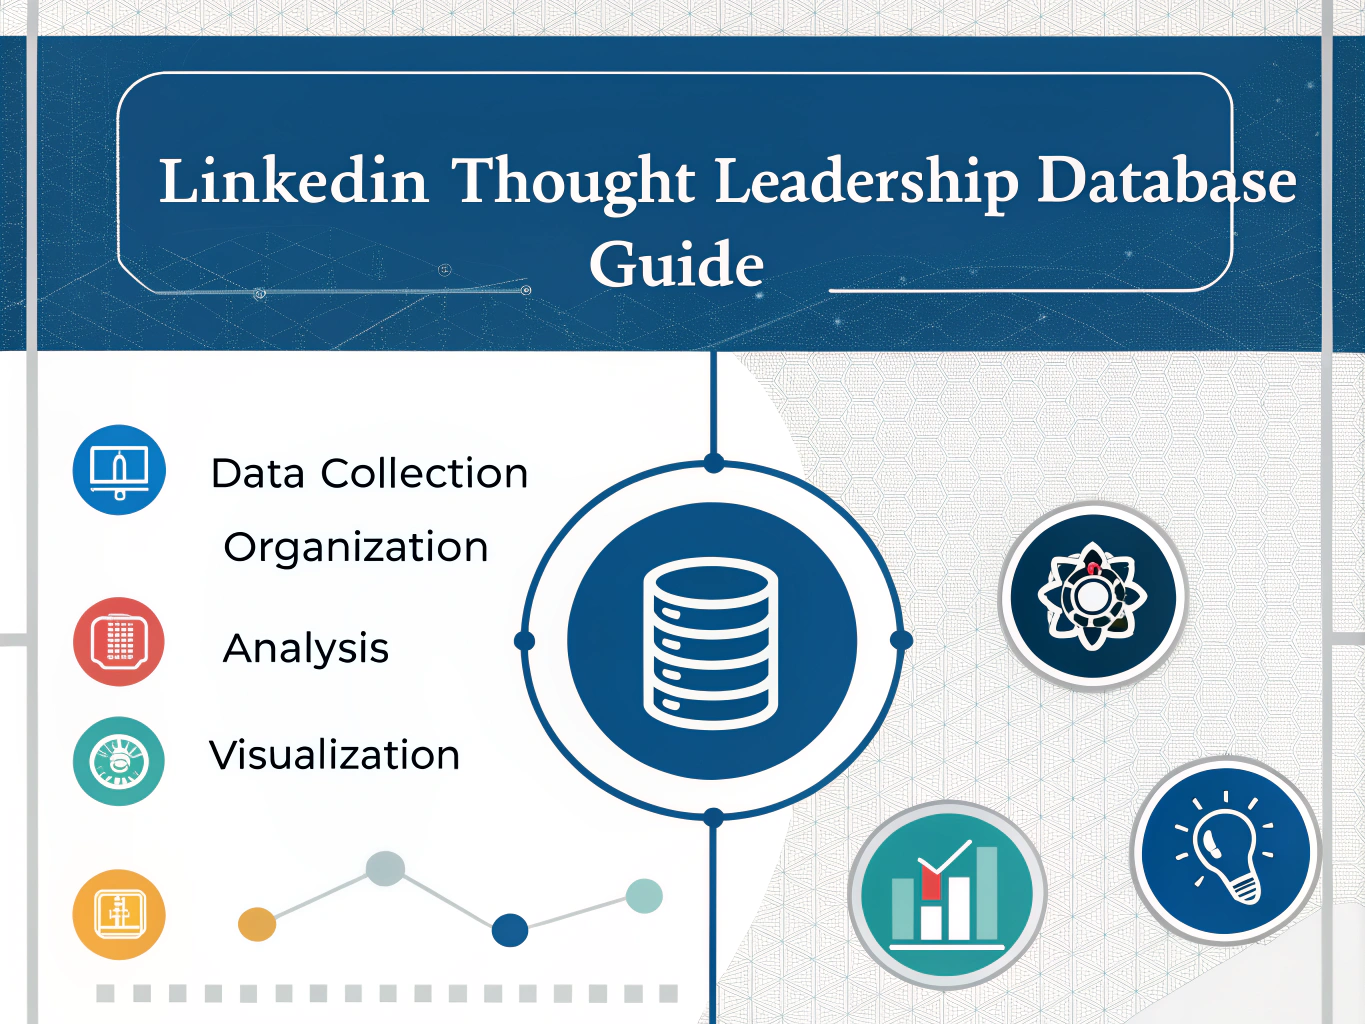
LinkedIn Thought Leadership Database Guide
Is this tool helpful?
How to Use the LinkedIn Thought Leadership Database Guide Generator Effectively
To make the most of this powerful tool for creating a comprehensive guide for your LinkedIn thought leadership database, follow these steps:
- Enter Research Keywords: In the first field, input relevant keywords for researching LinkedIn thought leadership statistics. For example, you might enter “LinkedIn content engagement rates” or “thought leadership ROI metrics”.
- Specify Statistic Categories: In the second field, list the categories you want to use for organizing your statistics. Separate each category with a comma. For instance, you could enter “Content performance, Audience growth, Influencer collaborations”.
- Define Database Structure (Optional): If you have a specific database structure in mind, describe it in the third field. You might enter something like “Statistic name, Numerical value, Source URL, Publication date, Relevance score”.
- Choose Visualization Types (Optional): In the last field, specify the types of visualizations you’d like to create with your data. For example, you could enter “Line graphs for trends, Heatmaps for engagement patterns, Funnel charts for conversion rates”.
- Generate Your Guide: Click the “Generate Thought Leadership Database Guide” button to create your customized guide based on the information you’ve provided.
Once the guide is generated, you can review it in the results section and copy it to your clipboard for further use.
Understanding the LinkedIn Thought Leadership Database Guide Generator
In today’s digital age, establishing yourself as a thought leader on LinkedIn has become crucial for professionals and businesses alike. However, creating and maintaining a comprehensive database of thought leadership statistics can be a daunting task. This is where our LinkedIn Thought Leadership Database Guide Generator comes into play.
This innovative tool is designed to streamline the process of creating a structured guide for developing your personal branding statistics database, with a focus on thought leadership on LinkedIn. By inputting your specific requirements and preferences, you’ll receive a tailored guide that outlines the steps to create, organize, and analyze your thought leadership data effectively.
Key Features of the Guide Generator
- Customized Research Focus: By inputting your research keywords, the tool ensures that your guide is tailored to your specific areas of interest within thought leadership on LinkedIn.
- Flexible Categorization: The ability to specify your own statistic categories allows for a personalized organizational structure that aligns with your unique thought leadership strategy.
- Database Structure Recommendations: For those unsure about how to structure their database, the tool provides suggestions based on best practices in data management for thought leadership statistics.
- Visualization Guidance: By specifying your preferred visualization types, you’ll receive tailored advice on how to present your data in the most impactful way for your audience.
Benefits of Using the LinkedIn Thought Leadership Database Guide Generator
1. Time and Resource Efficiency
Creating a comprehensive guide for a thought leadership database from scratch can be incredibly time-consuming. This tool significantly reduces the time and effort required by providing a structured framework tailored to your needs. Instead of spending hours researching best practices and organizational methods, you can focus on implementing the guide and collecting valuable data.
2. Improved Data Organization
With the ability to specify your own categories and database structure, you ensure that your thought leadership statistics are organized in a way that makes sense for your specific goals and strategy. This improved organization leads to easier data retrieval, analysis, and application in your thought leadership content.
3. Enhanced Data Visualization
By specifying your preferred visualization types, you receive guidance on creating impactful visual representations of your data. This can significantly enhance your ability to communicate insights effectively, whether in LinkedIn posts, articles, or presentations.
4. Customized Research Focus
The tool’s ability to incorporate your specific research keywords ensures that your guide is tailored to your niche within thought leadership. This focused approach helps you gather and analyze the most relevant statistics for your area of expertise.
5. Scalability and Adaptability
As your thought leadership strategy evolves, you can easily generate new guides with updated keywords, categories, or visualization preferences. This scalability ensures that your database structure can grow and adapt alongside your personal brand.
Addressing User Needs and Solving Specific Problems
Problem: Lack of Structure in Data Collection
Many aspiring thought leaders struggle with collecting and organizing relevant statistics in a structured manner. This tool solves this problem by providing a clear framework for data collection and organization. For example, if a user inputs “LinkedIn video engagement” as a research keyword and “Content types, Engagement metrics, Audience demographics” as categories, the generated guide will provide specific steps for collecting and categorizing video engagement statistics on LinkedIn.
Problem: Difficulty in Identifying Relevant Metrics
Users often struggle to determine which metrics are most relevant to track for thought leadership on LinkedIn. By allowing users to input their specific research keywords, the tool helps narrow down the most pertinent metrics. For instance, if a user enters “thought leadership influence measurement” as a keyword, the guide will focus on metrics such as content sharing rates, comment quality, and follower growth, providing a clear direction for data collection.
Problem: Ineffective Data Visualization
Many users find it challenging to present their data in a compelling way. By specifying visualization types, users receive tailored advice on creating impactful visual representations. For example, if a user requests “Bubble charts for network growth, Sankey diagrams for content flow” in the visualization field, the guide will provide specific instructions on how to create these visualizations using LinkedIn thought leadership data.
Practical Applications and Use Cases
Use Case 1: Content Strategy Optimization
A marketing professional wants to optimize their LinkedIn content strategy based on data-driven insights. They use the tool with the following inputs:
- Research Keywords: “LinkedIn post engagement, content type performance”
- Statistic Categories: “Post types, Engagement rates, Audience segments”
- Visualization Types: “Bar charts for engagement comparison, Heat maps for posting times”
The generated guide provides a structured approach to collecting and analyzing data on post engagement across different content types and audience segments. By following this guide, the marketing professional can identify which types of content perform best with specific audience segments and optimize their posting schedule for maximum engagement.
Use Case 2: Influencer Collaboration Analysis
A business development manager wants to analyze the impact of collaborations with other thought leaders on their LinkedIn presence. They use the tool with these inputs:
- Research Keywords: “LinkedIn influencer collaborations, co-created content performance”
- Statistic Categories: “Collaboration types, Reach metrics, Engagement lift”
- Visualization Types: “Network graphs for collaboration relationships, Before-and-after bar charts for engagement lift”
The resulting guide outlines methods for tracking the performance of collaborative content, measuring the reach of different collaboration types, and visualizing the network of influencer relationships. This structured approach allows the manager to quantify the impact of collaborations and make data-driven decisions about future partnership opportunities.
Use Case 3: Personal Brand Growth Tracking
An executive wants to track the growth of their personal brand on LinkedIn over time. They use the tool with the following inputs:
- Research Keywords: “LinkedIn profile views growth, recommendation frequency”
- Statistic Categories: “Profile engagement, Network growth, Endorsement metrics”
- Visualization Types: “Line graphs for longitudinal growth, Pie charts for skill endorsements”
The guide generated provides a comprehensive framework for tracking various aspects of personal brand growth on LinkedIn. It outlines methods for collecting data on profile views, connection growth rates, and endorsement patterns. By following this guide, the executive can create a dashboard that visualizes their personal brand growth over time, helping them identify successful strategies and areas for improvement.
Frequently Asked Questions (FAQ)
Q1: How often should I update my LinkedIn thought leadership database?
A1: The frequency of updates depends on your specific goals and the rate of change in your industry. However, a good practice is to update your database at least monthly to track trends effectively. For rapidly changing metrics or during specific campaigns, you might want to update more frequently, such as weekly or even daily.
Q2: Can I use this guide for other social media platforms besides LinkedIn?
A2: While this guide is specifically tailored for LinkedIn thought leadership, many of the principles and structures can be adapted for other social media platforms. You may need to adjust some metrics and data collection methods to fit the specific features of other platforms.
Q3: How many statistics should I aim to include in my database?
A3: The number of statistics depends on the scope of your thought leadership efforts and the depth of analysis you require. Start with a core set of 20-30 key metrics that align closely with your goals. As you become more comfortable with data analysis, you can expand your database to include more detailed or niche statistics.
Q4: What tools can I use to collect data for my thought leadership database?
A4: LinkedIn provides native analytics for your personal profile and company pages. Additionally, you can use tools like Google Analytics for website traffic from LinkedIn, social media management platforms like Hootsuite or Buffer for engagement metrics, and CRM systems for tracking leads generated through LinkedIn. For more advanced analysis, consider using data visualization tools like Tableau or PowerBI.
Q5: How can I ensure the statistics I’m collecting are relevant to my thought leadership goals?
A5: Start by clearly defining your thought leadership goals and the key performance indicators (KPIs) that align with these goals. Use these KPIs to guide your data collection. Regularly review the utility of each statistic in your database and be willing to add or remove metrics as your strategy evolves. Engage with your audience to understand what types of insights they find valuable, and adjust your data collection accordingly.
Q6: Can this guide help me compare my thought leadership performance to industry benchmarks?
A6: While the guide primarily focuses on structuring your own data collection, it can be adapted to include industry benchmarks. When inputting research keywords, include terms like “industry averages” or “thought leadership benchmarks” to ensure your guide includes steps for collecting and comparing benchmark data. You can then use this information to contextualize your performance within your industry.
Q7: How can I use the insights from my thought leadership database to improve my content strategy?
A7: The insights from your database can inform various aspects of your content strategy:
- Content Topics: Identify which topics generate the most engagement and focus on creating more content in those areas.
- Content Formats: Determine which types of posts (e.g., text, images, videos) perform best and adjust your content mix accordingly.
- Posting Schedule: Analyze engagement patterns to optimize your posting times and frequency.
- Audience Targeting: Use demographic insights to tailor your content to your most engaged audience segments.
- Collaboration Opportunities: Identify potential collaborators based on engagement with shared content or mutual connections.
Q8: Is it necessary to have advanced statistical knowledge to use this guide effectively?
A8: While some basic understanding of data analysis is helpful, advanced statistical knowledge is not necessary to use this guide effectively. The guide is designed to be accessible to users with varying levels of data expertise. It provides a structured approach to data collection and organization, which can be valuable even without advanced analysis. As you become more comfortable with the data, you can gradually incorporate more sophisticated analytical techniques.
Q9: How can I ensure the security of the data in my thought leadership database?
A9: To ensure the security of your thought leadership database:
- Use secure, password-protected platforms for data storage.
- Regularly backup your data to prevent loss.
- Limit access to your database to only those who need it.
- If using cloud-based storage, ensure the service has strong security measures in place.
- Regularly update any software or tools you use to manage your database.
- Be cautious about sharing specific data publicly, especially if it includes sensitive information about your audience or strategy.
Q10: Can this guide help me monetize my thought leadership on LinkedIn?
A10: While the primary focus of this guide is on organizing and analyzing thought leadership data, the insights gained can certainly contribute to monetization efforts. By understanding which content performs best, which topics resonate with your audience, and how your network is growing, you can make informed decisions about:
- Developing paid products or services based on your most popular content topics.
- Identifying potential sponsorship or partnership opportunities.
- Creating targeted lead generation campaigns.
- Optimizing your profile to attract speaking engagements or consulting opportunities.
- Demonstrating your thought leadership value to potential employers or clients.
Important Disclaimer
The calculations, results, and content provided by our tools are not guaranteed to be accurate, complete, or reliable. Users are responsible for verifying and interpreting the results. Our content and tools may contain errors, biases, or inconsistencies. We reserve the right to save inputs and outputs from our tools for the purposes of error debugging, bias identification, and performance improvement. External companies providing AI models used in our tools may also save and process data in accordance with their own policies. By using our tools, you consent to this data collection and processing. We reserve the right to limit the usage of our tools based on current usability factors. By using our tools, you acknowledge that you have read, understood, and agreed to this disclaimer. You accept the inherent risks and limitations associated with the use of our tools and services.
