P-Value Calculator
Is this tool helpful?
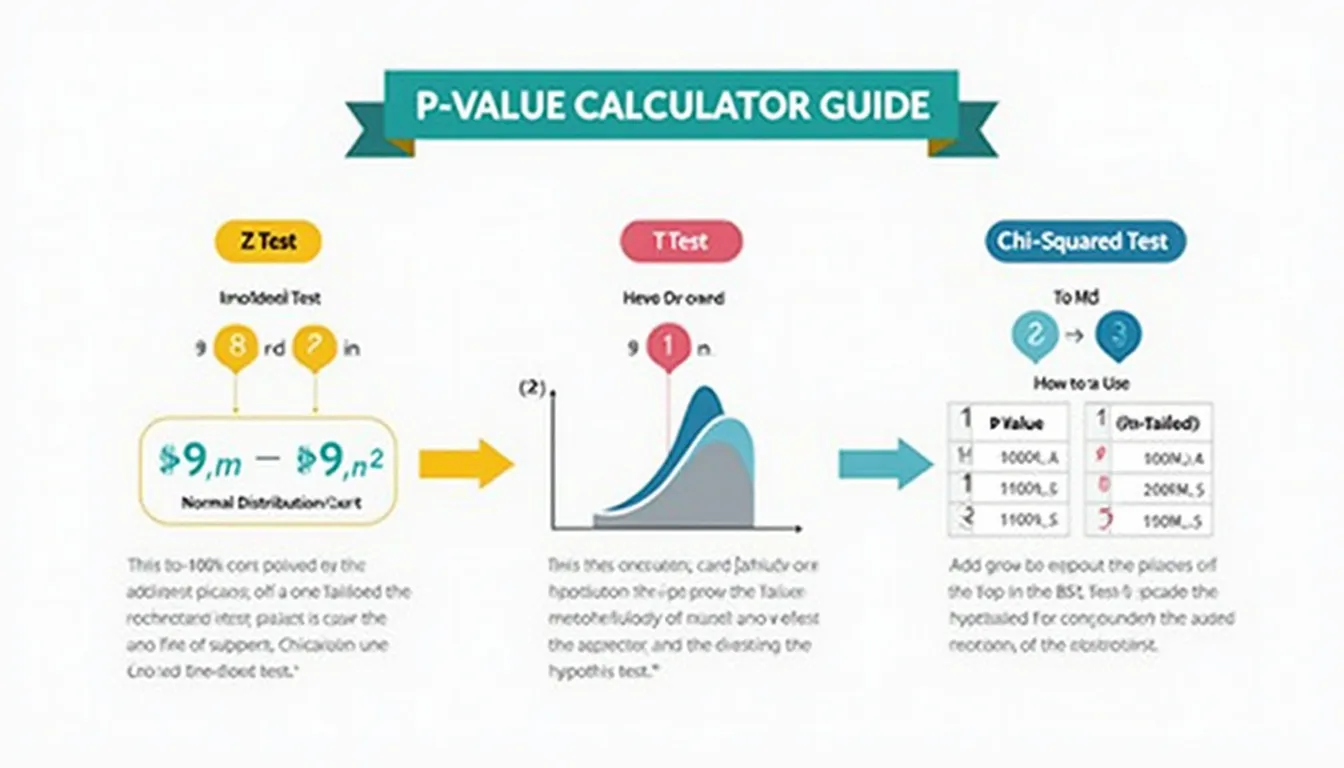
How to use the tool
- Pick a test type – Z-test, t-test or Chi-square – in the drop-down.
- Enter numeric fields
Z-test: Sample Mean (e.g., 102 or 87.5), Population Mean (e.g., 100), Population SD (e.g., 8 or 5.3), Sample Size (e.g., 64).
t-test: Sample Mean (e.g., 15.2 or 19.8), Population Mean (e.g., 14), Sample SD (e.g., 3), Sample Size (e.g., 16).
Chi-square: Observed “18,22,10” or “45,30,25”; Expected “15,25,10” or “40,35,25”. - Set α – leave blank for 0.05 or type 0.01 / 0.10.
- Choose tail – Two-tailed checks any difference; One-tailed checks direction.
- Press calculate – The page shows p-value, statistic, df and a clear keep/reject decision.
Formulas used
- Z-test: $$Z= rac{\bar X-\mu_0}{\sigma/\sqrt n}$$
- t-test: $$t= rac{\bar X-\mu_0}{s/\sqrt n},\;df=n-1$$
- Chi-square: $$\chi^{2}=\sum rac{(O_i-E_i)^2}{E_i},\;df=k-1$$
Worked examples
- Z-example: X̄ = 102, μ₀ = 100, σ = 8, n = 64.
$$Z= rac{2}{8/\sqrt{64}}=2$$ Two-tailed p = 0.045 ($$2\,[1-\Phi(2)]$$). Decision: reject at α = 0.05. - t-example: X̄ = 15.2, μ₀ = 14, s = 3, n = 16.
$$t= rac{1.2}{3/4}=1.6,\;df=15$$ One-tailed p ≈ 0.066 (NIST t-table). Fail to reject at α = 0.05. - χ²-example: O = 18,22,10; E = 15,25,10.
$$\chi^{2}=0.96,\;df=2$$ p ≈ 0.618. Fail to reject.
Quick-Facts
- α = 0.05 originated with Fisher’s “Statistical Methods” (Fisher, 1925).
- Z-test assumes known σ and n > 30 (Moore & McCabe, 2017).
- t-distribution approaches normality when df > 30 (NIST/SEMATECH Handbook, 2023).
- Each expected count in χ²-test should be ≥5 for validity (Cochran, 1954).
FAQ
What is a p-value?
A p-value quantifies the probability of observing data as extreme as yours assuming the null hypothesis is true (Wasserstein et al., 2019).
When should I choose a Z-test?
Use a Z-test when the population standard deviation is known and your sample size exceeds 30, ensuring the sampling distribution is approximately normal (Moore & McCabe, 2017).
Why does the calculator ask for tail type?
A one-tailed test pools probability in one direction, doubling power in that direction, while a two-tailed test splits probability to detect any difference (Sharma, 2021).
How do degrees of freedom affect the t-test?
Lower df widen the t-distribution, increasing the critical value required for significance; df = n – 1 for a single-sample t-test (NIST Handbook, 2023).
Can I use the Chi-square test with small expected counts?
If any expected frequency falls below 5, switch to Fisher’s Exact or merge categories to meet Cochran’s rule (Cochran, 1954).
What does “reject the null” mean?
You concluded that the observed data are unlikely under H₀ at the chosen α, so you accept the alternative explanation (Fisher, 1925).
How can I lower Type I error risk?
Set a stricter α (e.g., 0.01) or apply Bonferroni correction when running multiple tests (Armstrong, 2014).
Is statistical significance the same as practical significance?
No. Statistical significance shows an effect exists; practical significance judges its real-world impact, often via effect size measures like Cohen’s d (Cohen, 1988).
Important Disclaimer
The calculations, results, and content provided by our tools are not guaranteed to be accurate, complete, or reliable. Users are responsible for verifying and interpreting the results. Our content and tools may contain errors, biases, or inconsistencies. Do not enter personal data, sensitive information, or personally identifiable information in our web forms or tools. Such data entry violates our terms of service and may result in unauthorized disclosure to third parties. We reserve the right to save inputs and outputs from our tools for the purposes of error debugging, bias identification, and performance improvement. External companies providing AI models used in our tools may also save and process data in accordance with their own policies. By using our tools, you consent to this data collection and processing. We reserve the right to limit the usage of our tools based on current usability factors.