P-Value Calculator: Z-Test, T-Test, Chi-Square Test for Statistical Significance

Unlock the power of statistical analysis with our P-Value Calculator. From Z-tests to Chi-Square, this versatile tool simplifies hypothesis testing across disciplines. Boost your research accuracy, save time, and make data-driven decisions with confidence. Discover how p-values can transform your analytical approach today!

P-Value Calculator

Enter the mean of your sample data

Enter the hypothesized population mean

Enter the known population standard deviation

Enter the number of observations in your sample

Default is 0.05 if left blank

How to Use the P-Value Calculator Effectively

Step-by-Step Guide

Our P-Value Calculator is a powerful tool designed to help you perform statistical hypothesis testing with ease. Follow these steps to use the calculator effectively:

  1. Select the Test Type: Choose from Z-test, T-test, or Chi-Square Test based on your data and research question.
  2. Enter Required Data: Input the necessary values for your chosen test. The fields will dynamically update based on your selection.
  3. Choose Test Direction: Select whether you’re conducting a one-tailed or two-tailed test.
  4. Set Significance Level: Enter your desired significance level (α), typically 0.05.
  5. Calculate: Click the “Calculate P-value” button to obtain your results.
  6. Interpret Results: Review the calculated test statistic, p-value, and conclusion provided.

Input Fields Explained

  • Sample Mean (𝑥̄): The average of your sample data (e.g., 105 for a Z-test).
  • Population Mean (μ₀): The hypothesized mean of the population (e.g., 100).
  • Population Standard Deviation (σ): For Z-tests, the known standard deviation of the population (e.g., 15).
  • Sample Standard Deviation (s): For T-tests, the calculated standard deviation of your sample (e.g., 4).
  • Sample Size (n): The number of observations in your sample (e.g., 36 for a Z-test, 16 for a T-test).
  • Observed Frequencies (Oᵢ): For Chi-Square tests, enter comma-separated values of observed counts (e.g., 50, 30, 20).
  • Expected Frequencies (Eᵢ): For Chi-Square tests, enter comma-separated values of expected counts (e.g., 40, 40, 20).

Understanding P-Values: Your Gateway to Statistical Significance

The P-Value Calculator is an indispensable tool for researchers, students, and professionals engaged in statistical analysis. It provides a quick and accurate way to determine the statistical significance of your results, helping you make informed decisions based on your data.

What is a P-Value?

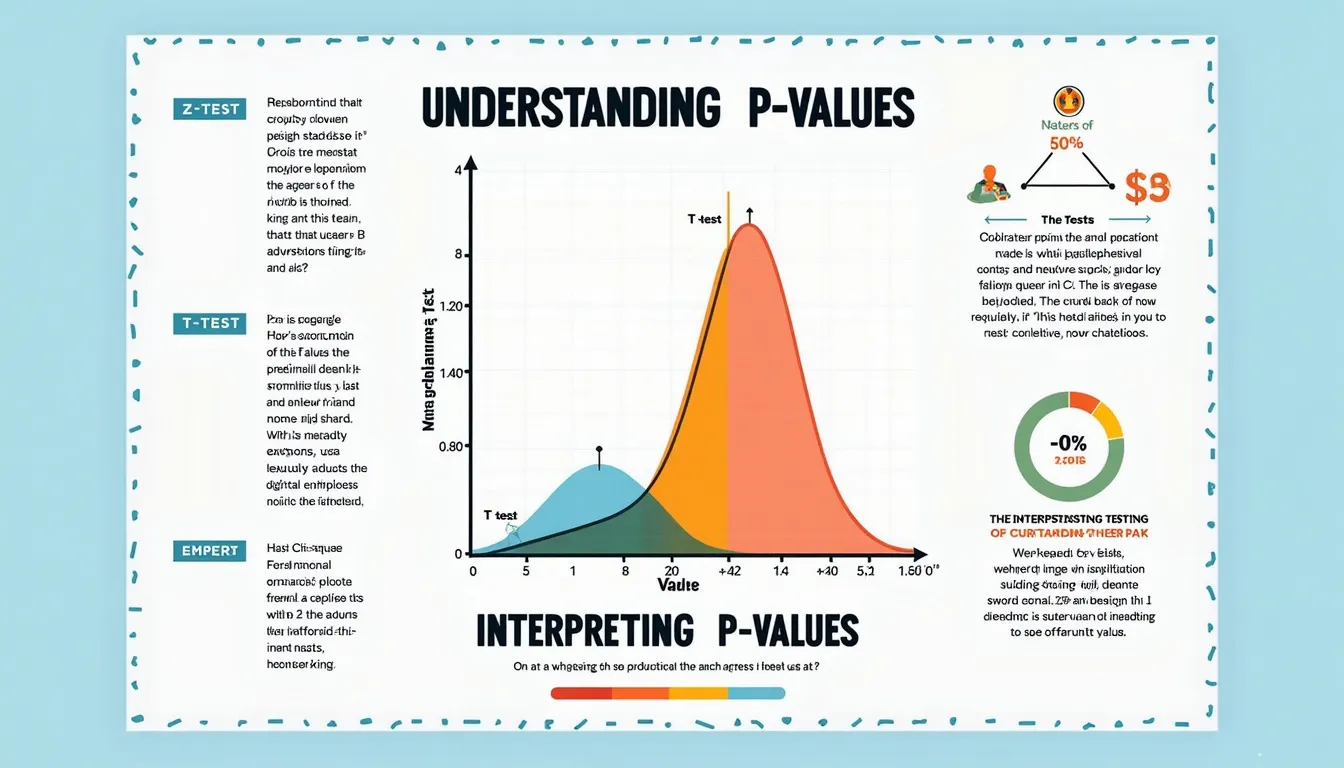
A p-value, or probability value, is a measure used in statistical hypothesis testing to help you decide whether to reject or fail to reject your null hypothesis. It represents the probability of obtaining test results at least as extreme as the observed results, assuming that the null hypothesis is true.

$$P(observed\,or\,more\,extreme\,outcome\,|\,null\,hypothesis\,is\,true)$$

In simpler terms, the p-value tells you how likely it is that your results occurred by chance. A small p-value (typically ≤ 0.05) suggests strong evidence against the null hypothesis, indicating that your results are statistically significant.

Why Use a P-Value Calculator?

Calculating p-values manually can be time-consuming and prone to errors, especially for complex statistical tests. Our P-Value Calculator automates this process, offering several benefits:

  • Accuracy: Eliminates human error in calculations.
  • Efficiency: Saves time, allowing you to focus on interpreting results.
  • Flexibility: Supports multiple test types (Z-test, T-test, Chi-Square).
  • Visualization: Provides graphical representation of results.
  • Accessibility: No need for specialized statistical software.

Benefits of Using the P-Value Calculator

1. Streamlined Hypothesis Testing

Our calculator simplifies the process of hypothesis testing, guiding you through each step:

  • Formulating null and alternative hypotheses
  • Selecting the appropriate statistical test
  • Calculating the test statistic
  • Determining the p-value
  • Drawing conclusions based on the significance level

2. Enhanced Decision Making

By providing accurate p-values, the calculator empowers you to make data-driven decisions with confidence. Whether you’re conducting research, analyzing business metrics, or evaluating scientific experiments, you can trust the results to inform your choices.

3. Time and Resource Savings

Manual calculations or complex statistical software can be time-consuming and costly. Our free, web-based calculator offers a quick and accessible alternative, saving you valuable time and resources.

4. Educational Tool

For students and educators, the P-Value Calculator serves as an excellent learning aid. It helps reinforce statistical concepts by providing immediate results and visual representations, making abstract ideas more concrete.

5. Versatility Across Disciplines

The calculator’s support for multiple test types makes it valuable across various fields, including:

  • Social Sciences
  • Medical Research
  • Business Analytics
  • Engineering
  • Environmental Studies

Addressing User Needs: How the P-Value Calculator Solves Specific Problems

Problem 1: Determining Statistical Significance in Large Samples

Researchers often work with large datasets where even small differences can appear significant. The Z-test functionality of our calculator helps address this issue.

Example Calculation: Z-Test

A company wants to determine if a new production method has increased the average weight of their product. They have the following data:

  • Sample Mean (𝑥̄) = 52.3 grams
  • Population Mean (μ₀) = 50 grams
  • Population Standard Deviation (σ) = 5 grams
  • Sample Size (n) = 100

Using the calculator:

$$z = \frac{52.3 – 50}{\frac{5}{\sqrt{100}}} = 4.6$$

The calculator would return a p-value of approximately 0.0000042, which is much smaller than the typical significance level of 0.05. This suggests strong evidence against the null hypothesis, indicating that the new production method has indeed increased the average weight of the product.

Problem 2: Analyzing Small Sample Sizes

In many real-world scenarios, researchers work with small sample sizes where the population standard deviation is unknown. The T-test functionality of our calculator is ideal for such situations.

Example Calculation: T-Test

A nutritionist is testing a new diet plan and wants to know if it significantly reduces cholesterol levels. They have the following data from a small group of participants:

  • Sample Mean (𝑥̄) = 185 mg/dL
  • Population Mean (μ₀) = 200 mg/dL (average cholesterol level before the diet)
  • Sample Standard Deviation (s) = 20 mg/dL
  • Sample Size (n) = 15

Using the calculator:

$$t = \frac{185 – 200}{\frac{20}{\sqrt{15}}} = -2.905$$

The calculator would return a p-value of approximately 0.0114 for a two-tailed test. This p-value is less than the common significance level of 0.05, suggesting that the diet plan has a statistically significant effect on reducing cholesterol levels.

Problem 3: Analyzing Categorical Data

Researchers often need to compare observed frequencies with expected frequencies in categorical data. The Chi-Square test functionality of our calculator is designed for such analyses.

Example Calculation: Chi-Square Test

A geneticist is studying the inheritance of flower colors in a certain plant species. According to Mendelian genetics, they expect a 1:2:1 ratio of red:pink:white flowers. In a sample of 300 plants, they observed:

  • Observed Frequencies (Oᵢ): 70 red, 160 pink, 70 white
  • Expected Frequencies (Eᵢ): 75 red, 150 pink, 75 white

Using the calculator:

$$\chi^2 = \frac{(70-75)^2}{75} + \frac{(160-150)^2}{150} + \frac{(70-75)^2}{75} = 0.8667$$

The calculator would return a p-value of approximately 0.6484 for 2 degrees of freedom. This p-value is much larger than the typical significance level of 0.05, suggesting that there is not enough evidence to reject the null hypothesis. The observed frequencies are consistent with the expected 1:2:1 ratio.

Practical Applications of the P-Value Calculator

1. Medical Research

In clinical trials, researchers use p-values to determine if a new treatment is significantly more effective than a placebo or existing treatment. For example, a pharmaceutical company might use a t-test to compare the mean reduction in blood pressure between a new drug and a placebo group.

2. Quality Control in Manufacturing

Manufacturers can use z-tests to monitor product quality. For instance, a electronics company might regularly test if the mean battery life of their smartphones differs significantly from the advertised 24 hours.

3. Market Research

Marketing teams often use chi-square tests to analyze survey data. For example, they might compare the observed preferences for different product features against expected preferences to guide product development decisions.

4. Environmental Studies

Ecologists might use t-tests to determine if pollution levels in a river have changed significantly over time, comparing current measurements with historical data.

5. Educational Assessment

Educators can use z-tests to compare the performance of their students on standardized tests against national averages, helping identify areas for curriculum improvement.

Frequently Asked Questions (FAQ)

Q1: What significance level should I use?

The most commonly used significance level is 0.05, but this can vary depending on your field and the nature of your research. Some studies may use 0.01 for more stringent criteria, while others might use 0.1 for exploratory research.

Q2: What’s the difference between one-tailed and two-tailed tests?

A one-tailed test looks for an effect in one direction (either greater than or less than), while a two-tailed test looks for an effect in either direction. Two-tailed tests are more common as they don’t assume the direction of the effect.

Q3: How do I interpret the p-value?

If the p-value is less than your chosen significance level (e.g., 0.05), you reject the null hypothesis. This suggests that your results are statistically significant. If the p-value is greater than the significance level, you fail to reject the null hypothesis.

Q4: Can a small p-value guarantee that my alternative hypothesis is true?

No, a small p-value doesn’t prove that your alternative hypothesis is true. It only suggests that the observed data is unlikely under the null hypothesis. Other factors, like study design and practical significance, should also be considered.

Q5: What sample size should I use?

Sample size depends on various factors including the effect size you’re looking for, the desired power of your test, and the variability in your data. Generally, larger sample sizes provide more reliable results. Consider consulting a statistician for complex studies.

Q6: Can I use the Z-test for small sample sizes?

It’s generally recommended to use the T-test for small sample sizes (typically n < 30) when the population standard deviation is unknown. The Z-test is more appropriate for larger sample sizes or when the population standard deviation is known.

Q7: How do degrees of freedom affect my results?

Degrees of freedom influence the shape of the t-distribution and chi-square distribution. As degrees of freedom increase, these distributions approach the normal distribution. This affects the calculation of p-values, especially for smaller sample sizes.

Q8: What if my data isn’t normally distributed?

The Z-test and T-test assume normally distributed data. If your data significantly deviates from normality, consider using non-parametric tests like the Wilcoxon rank-sum test or the Kruskal-Wallis test.

Q9: Can I use this calculator for paired data?

This calculator is designed for independent samples. For paired data (e.g., before-after measurements on the same subjects), you would need to use a paired t-test, which is not currently included in this calculator.

Q10: How do I report p-values in my research?

It’s generally recommended to report the exact p-value (e.g., p = 0.032) rather than just stating whether it’s significant or not. This allows readers to interpret the strength of evidence themselves. For very small p-values, you can report them as p < 0.001.

By addressing these common questions, users can gain a deeper understanding of p-values and how to effectively use the P-Value Calculator in their statistical analyses. Remember, while p-values are a valuable tool in statistical inference, they should be interpreted in the context of your study design, sample size, and practical significance of the results.

Important Disclaimer

The calculations, results, and content provided by our tools are not guaranteed to be accurate, complete, or reliable. Users are responsible for verifying and interpreting the results. Our content and tools may contain errors, biases, or inconsistencies. We reserve the right to save inputs and outputs from our tools for the purposes of error debugging, bias identification, and performance improvement. External companies providing AI models used in our tools may also save and process data in accordance with their own policies. By using our tools, you consent to this data collection and processing. We reserve the right to limit the usage of our tools based on current usability factors. By using our tools, you acknowledge that you have read, understood, and agreed to this disclaimer. You accept the inherent risks and limitations associated with the use of our tools and services.
Create Your Own Web Tool for Free