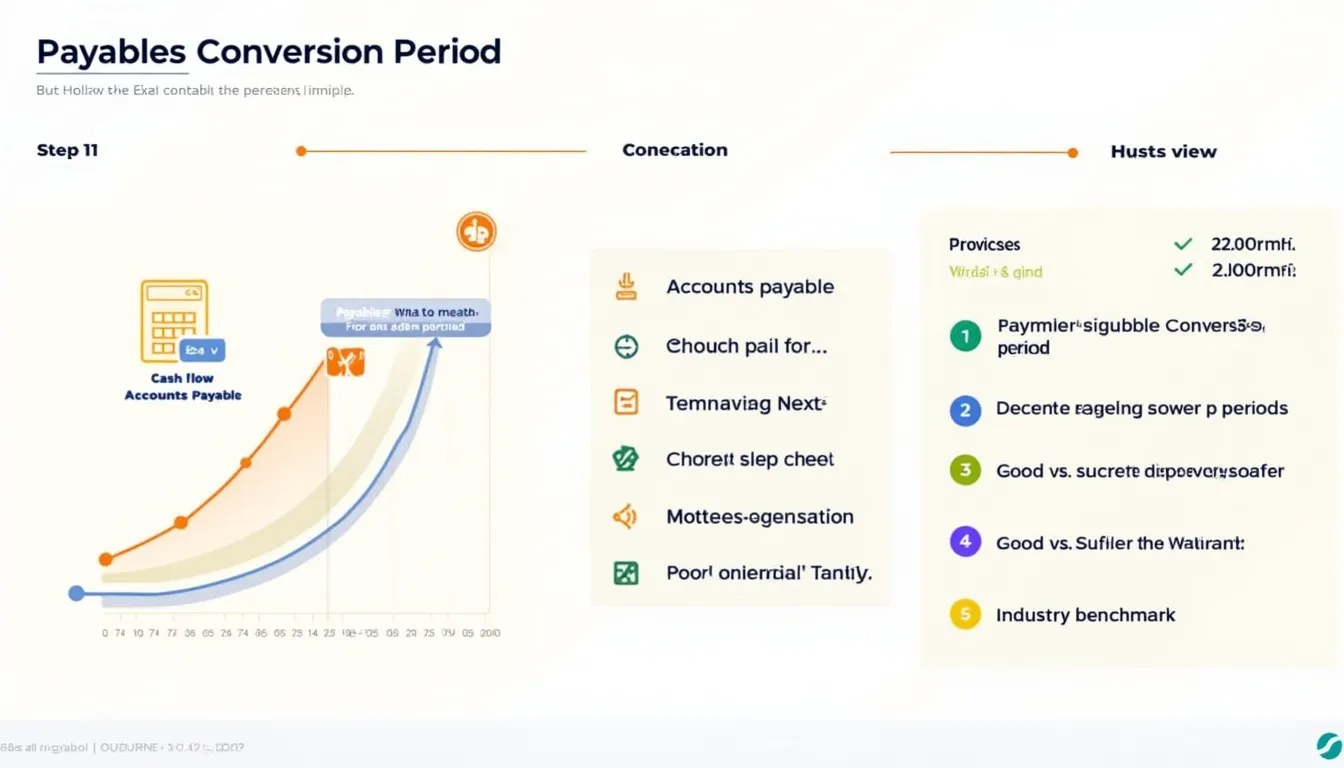
Payables Conversion Period Calculator
Is this tool helpful?
How to use the tool
- Enter Accounts Payable. Example 1: 32,500; Example 2: 88,000.
- Enter Purchases. Example 1: 150,000; Example 2: 520,000.
- Press “Calculate.” The page displays your Payables Conversion Period in days.
- Interpret the number. Compare it with industry norms and supplier terms to spot cash-flow gaps.
Formula used
$$\text{Payables Conversion Period}= rac{\text{Accounts Payable}}{\text{Purchases}}\times365$$
Checked example
- Accounts Payable = 32,500
- Purchases = 150,000
- Result = rac{32 500}{150 000}×365 = 79.08 days
Second example
- Accounts Payable = 88,000
- Purchases = 520,000
- Result = rac{88 000}{520 000}×365 = 61.73 days
Quick-Facts
- Median U.S. Days Payable Outstanding: 54 days (APQC, 2023).
- 30-60 days is the most common supplier term range (PwC Working Capital Report 2022).
- Late-payment fees average 1-1.5 % per month (UCC §2-710).
- Shorter DPO improves supplier trust, reducing stock-out risk by 17 % (Gartner SCM Survey 2021).
FAQ
What is the Payables Conversion Period?
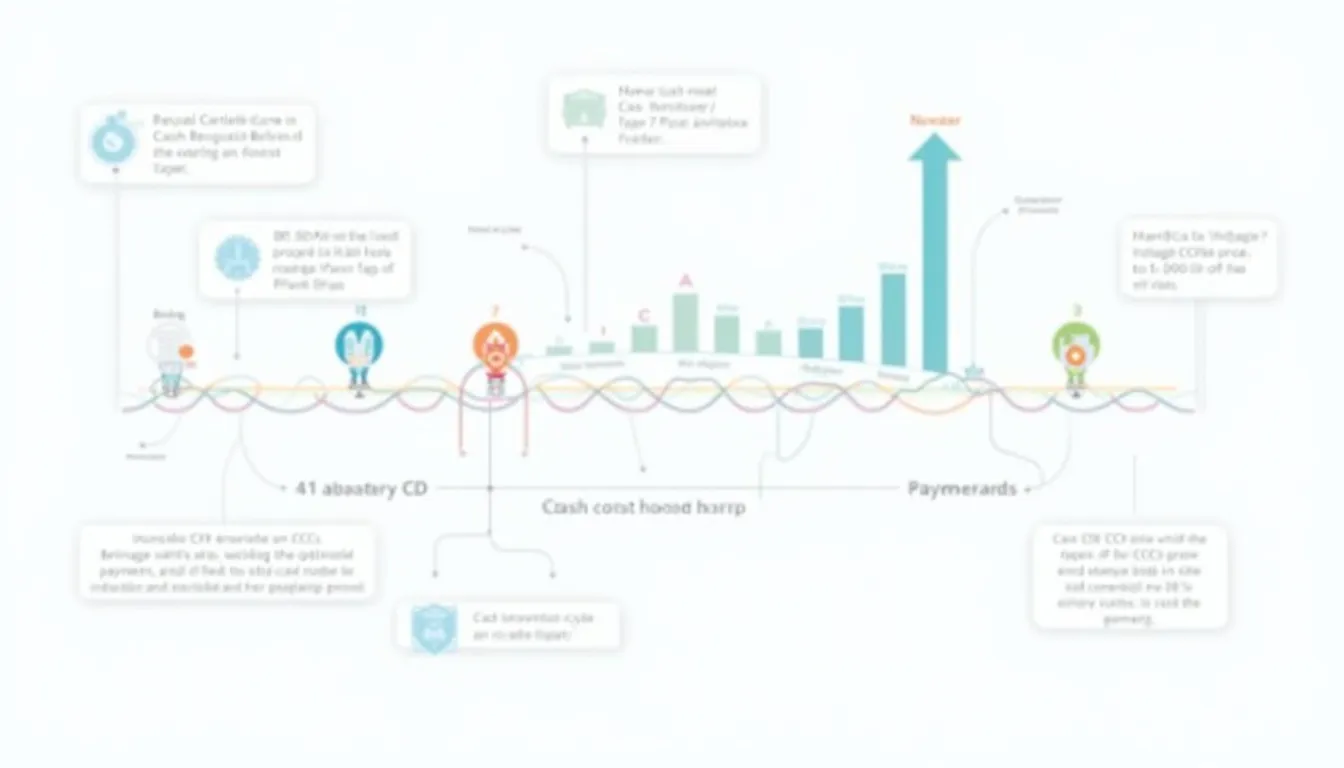
The Payables Conversion Period shows how many days your company takes to pay suppliers after a purchase (APQC, 2023).
Why does a shorter period matter?
Shorter periods cut late-fee costs and strengthen supplier relationships, improving on-time delivery by 15 % (Gartner 2021).
Is a longer period always negative?
No; using full credit terms frees cash for operations, but excessive delay incurs penalties and damages trust (PwC 2022).
How often should I run the calculator?
Run it monthly to align with closing cycles and spot emerging cash-flow issues early (CFO.com, 2022).
Which data source is best for Purchases?
Use cost-of-goods-sold from your latest income statement for the most reliable annual figure (FASB ASC 330).
Can I benchmark internationally?
Yes; European manufacturers average 68-day DPO, versus 54-day U.S. median (Euler Hermes Trade Report 2022).
How do early-payment discounts affect DPO?
Taking a 2/10 net-30 discount shortens DPO to about 10 days but saves 2 % invoice value (Investopedia, 2023).
What’s a quick improvement tip?
Automate invoice matching; companies using e-invoicing cut processing time 60 % (Ardent Partners State of ePayables 2023).
Important Disclaimer
The calculations, results, and content provided by our tools are not guaranteed to be accurate, complete, or reliable. Users are responsible for verifying and interpreting the results. Our content and tools may contain errors, biases, or inconsistencies. Do not enter personal data, sensitive information, or personally identifiable information in our web forms or tools. Such data entry violates our terms of service and may result in unauthorized disclosure to third parties. We reserve the right to save inputs and outputs from our tools for the purposes of error debugging, bias identification, and performance improvement. External companies providing AI models used in our tools may also save and process data in accordance with their own policies. By using our tools, you consent to this data collection and processing. We reserve the right to limit the usage of our tools based on current usability factors.
