Portfolio Return Monte Carlo Simulator: Estimate Investment Outcomes
Unlock the power of data-driven investing with our Portfolio Return Monte Carlo Simulator. Explore thousands of potential scenarios, assess risks, and optimize your strategy. From beginners to pros, this tool empowers smarter financial decisions. Ready to revolutionize your investment approach? Dive in now!
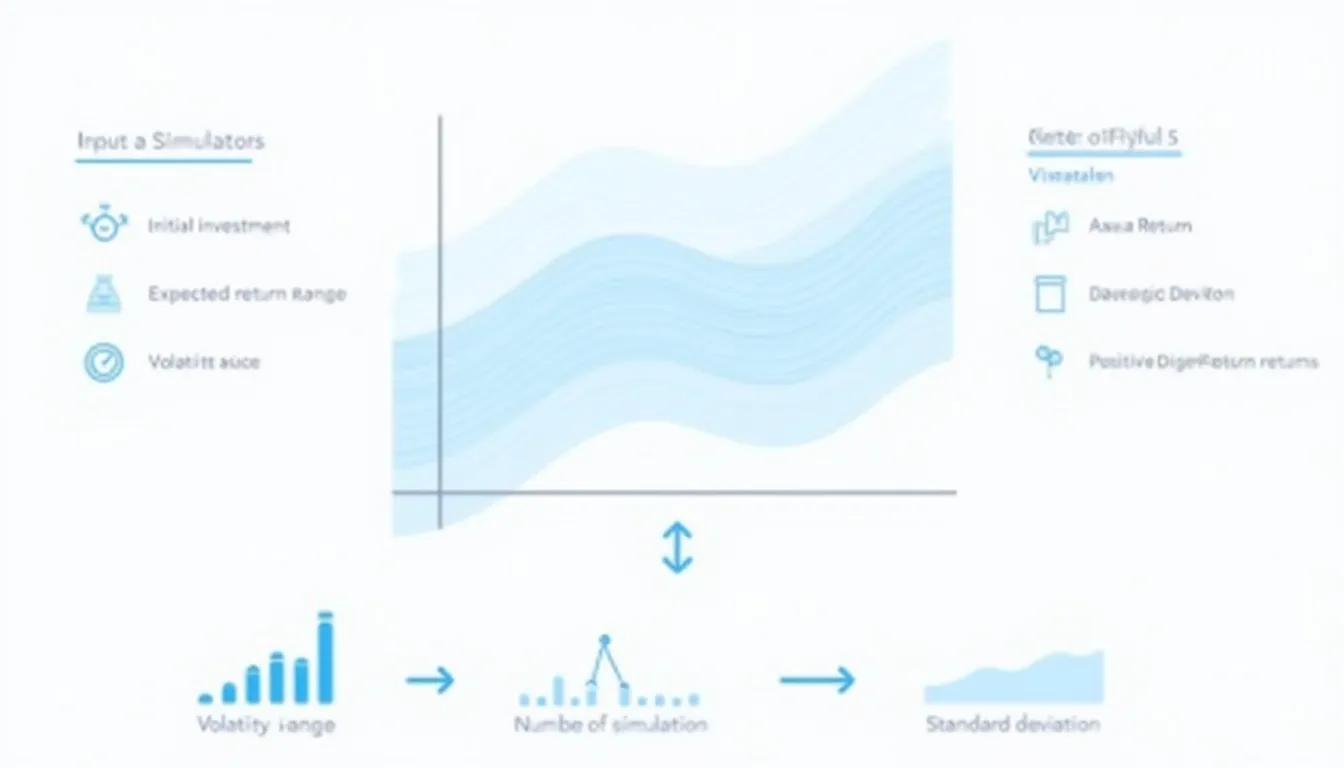
Portfolio Return Monte Carlo Simulator
Running simulation...
Error!
Simulation Results
Average Return:
Standard Deviation:
Minimum Return:
Maximum Return:
Positive Returns:
Negative Returns:
★ Add to Home Screen
×
Follow these steps:
Tap the Share button at the bottom of the browser
Scroll down and tap “Add to Home Screen”
Tap “Add” to confirm
Follow these steps:
Tap the menu icon (⋮) in the top right
Tap “Add to Home screen”
Tap “Add” to confirm
Follow these steps:
Click the menu icon (⋮) in the top right
Click “Bookmarks”
Click “Bookmark this tab” or press Ctrl+D (Cmd+D on Mac)
Is this tool helpful?
Thanks for your feedback!
Welcome to our advanced Portfolio Return Monte Carlo Simulator, a powerful tool designed to help investors make informed decisions about their investment strategies. This cutting-edge calculator utilizes the Monte Carlo simulation method to provide valuable insights into potential portfolio returns based on various market scenarios.
How to Use the Portfolio Return Monte Carlo Simulator Effectively
To get the most out of our simulator, follow these simple steps:
Enter your initial investment amount: Input the principal amount you plan to invest in USD.
Set the expected return range: Specify the lower and upper bounds of your expected annual return percentage.
Define the volatility range: Input the minimum and maximum annual volatility percentages you anticipate.
Choose the number of simulations: Decide how many Monte Carlo simulations you want to run (e.g., 1000, 5000, or 10000).
Run the simulation: Click the “Run Simulation” button to generate results.
Analyze the results: Review the comprehensive output, including average return, standard deviation, minimum and maximum returns, and the distribution of positive and negative outcomes.
Understanding Monte Carlo Simulation in Portfolio Analysis
Monte Carlo simulation is a sophisticated statistical technique used to model the probability of different outcomes in a process that cannot easily be predicted due to the intervention of random variables. In the context of portfolio analysis, it helps investors understand the range of possible returns and the likelihood of achieving specific financial goals.
The mathematical foundation of our Monte Carlo simulation is based on the following key concepts:
$$
R_p = \mu + \sigma \cdot Z
$$
Where:
Rp is the simulated portfolio return
μ is the expected return (randomly selected from the specified range)
σ is the volatility (randomly selected from the specified range)
Z is a random variable following a standard normal distribution
The simulator generates thousands of potential scenarios, each representing a possible future path for your portfolio. By aggregating these results, we can provide a comprehensive view of the potential outcomes and risks associated with your investment strategy.
Benefits of Using the Portfolio Return Monte Carlo Simulator
Our Portfolio Return Monte Carlo Simulator offers numerous advantages for investors of all levels:
Risk Assessment: Gain a deeper understanding of the potential risks associated with your investment strategy.
Scenario Analysis: Explore various market conditions and their impact on your portfolio’s performance.
Goal Setting: Determine the likelihood of achieving your financial objectives based on different investment approaches.
Strategy Optimization: Fine-tune your asset allocation and risk management strategies based on simulation results.
Educational Tool: Enhance your understanding of portfolio behavior under different market conditions.
Decision Support: Make more informed investment decisions backed by data-driven insights.
Addressing User Needs and Solving Investment Challenges
Our Portfolio Return Monte Carlo Simulator is designed to address several common challenges faced by investors:
1. Uncertainty in Market Conditions
One of the biggest challenges in investing is dealing with market uncertainty. Our simulator helps investors navigate this uncertainty by providing a range of potential outcomes based on different market scenarios.
2. Risk Management
Effective risk management is crucial for successful investing. By simulating thousands of potential scenarios, our tool helps investors understand the potential downside risks and adjust their strategies accordingly.
3. Long-term Planning
Long-term financial planning can be complex, especially when considering factors like compound interest and market volatility. Our simulator provides insights into potential long-term outcomes, helping investors make more informed decisions about their financial future.
4. Asset Allocation
Determining the optimal asset allocation for a portfolio can be challenging. By running simulations with different expected returns and volatilities, investors can gain insights into how different asset allocations might perform under various market conditions.
5. Performance Expectations
Setting realistic performance expectations is crucial for investor satisfaction and long-term success. Our simulator helps investors understand the range of potential outcomes, preventing overly optimistic or pessimistic expectations.
Practical Applications and Example Calculations
Let’s explore some practical applications of our Portfolio Return Monte Carlo Simulator through example calculations:
Example 1: Conservative vs. Aggressive Investment Strategies
Suppose an investor is considering two different investment strategies:
Conservative Strategy:
Initial Investment: $100,000
Expected Return Range: 4% to 6%
Volatility Range: 5% to 8%
Aggressive Strategy:
Initial Investment: $100,000
Expected Return Range: 8% to 12%
Volatility Range: 15% to 20%
Running 10,000 simulations for each strategy might yield the following results:
Conservative Strategy Results:
Average Return: 5.2%
Standard Deviation: 3.1%
Minimum Return: -4.8%
Maximum Return: 14.7%
Positive Returns: 8,750 (87.5%)
Negative Returns: 1,250 (12.5%)
Aggressive Strategy Results:
Average Return: 10.1%
Standard Deviation: 8.7%
Minimum Return: -18.3%
Maximum Return: 37.2%
Positive Returns: 7,800 (78%)
Negative Returns: 2,200 (22%)
These results illustrate the trade-off between risk and return. The aggressive strategy offers higher potential returns but also comes with greater volatility and a higher chance of negative outcomes.
Example 2: Retirement Planning
Consider an investor planning for retirement with the following parameters:
Initial Investment: $500,000
Expected Return Range: 6% to 8%
Volatility Range: 10% to 15%
Time Horizon: 20 years
Running 10,000 simulations might provide the following insights:
Average Portfolio Value after 20 years: $1,850,000
90th Percentile Value: $2,750,000
10th Percentile Value: $1,150,000
Probability of achieving at least $1,500,000: 75%
These results can help the investor assess whether their current savings and investment strategy align with their retirement goals, and make adjustments if necessary.
Example 3: Comparing Different Investment Options
An investor is considering allocating $200,000 across three different investment options:
Option A (Low Risk):
Expected Return Range: 3% to 5%
Volatility Range: 2% to 4%
Option B (Medium Risk):
Expected Return Range: 6% to 9%
Volatility Range: 8% to 12%
Option C (High Risk):
Expected Return Range: 10% to 15%
Volatility Range: 18% to 25%
The investor can use our simulator to compare different allocation strategies:
Strategy 1: Equal Allocation (33.33% each)
Average Return: 7.2%
Standard Deviation: 5.8%
Probability of Positive Return: 82%
Strategy 2: Conservative Allocation (50% A, 30% B, 20% C)
Average Return: 6.1%
Standard Deviation: 4.3%
Probability of Positive Return: 85%
Strategy 3: Aggressive Allocation (20% A, 30% B, 50% C)
Average Return: 8.7%
Standard Deviation: 7.9%
Probability of Positive Return: 78%
These simulations can help the investor choose an allocation strategy that best aligns with their risk tolerance and return objectives.
Frequently Asked Questions (FAQ)
1. What is Monte Carlo simulation, and how does it apply to portfolio analysis?
Monte Carlo simulation is a statistical technique that uses random sampling to obtain numerical results. In portfolio analysis, it involves generating thousands of possible scenarios for future market performance based on the expected returns and volatilities of different assets. This approach helps investors understand the range of potential outcomes and the probability of achieving specific financial goals.
2. How accurate are the results from the Portfolio Return Monte Carlo Simulator?
While our simulator provides valuable insights based on statistical models and user inputs, it’s important to note that it cannot predict the future with certainty. The accuracy of the results depends on the quality of the input parameters and the underlying assumptions of the model. The simulator should be used as a tool to gain insights and inform decision-making, not as a definitive predictor of future performance.
3. How many simulations should I run for reliable results?
Generally, running more simulations provides more stable and reliable results. We recommend running at least 1,000 simulations, but for more precise estimates, you may want to increase this to 10,000 or even 100,000 simulations. Keep in mind that increasing the number of simulations will also increase the computation time.
4. How should I interpret the standard deviation in the results?
The standard deviation is a measure of volatility or risk. A higher standard deviation indicates greater variability in potential returns. For example, if the average return is 7% with a standard deviation of 15%, it means that about 68% of the time, the annual return is expected to fall between -8% and 22% (one standard deviation below and above the mean).
5. Can I use this simulator for short-term investment decisions?
While the simulator can provide insights for various time horizons, it’s primarily designed for long-term investment planning. Short-term market movements are often more unpredictable and may not align well with the assumptions used in Monte Carlo simulations. For short-term decisions, additional tools and analysis methods may be more appropriate.
6. How often should I rerun the simulations for my portfolio?
It’s a good practice to rerun simulations periodically, especially when there are significant changes in your financial situation, investment goals, or market conditions. Many investors choose to review their portfolio and run new simulations annually or semi-annually. However, avoid making frequent changes based on short-term market fluctuations, as this can lead to overtrading and poor long-term performance.
7. Can the simulator account for different asset classes or specific stocks?
Our current simulator is designed to model overall portfolio performance rather than individual asset classes or stocks. The expected return and volatility ranges you input should reflect your expectations for the entire portfolio. For more detailed analysis of specific asset allocations or individual securities, you may need to use more advanced financial modeling tools.
8. How does inflation factor into the simulation results?
The simulator provides nominal returns, which do not account for inflation. To consider the effects of inflation, you can adjust your expected return inputs to reflect real (inflation-adjusted) returns. Alternatively, you can factor in an estimated inflation rate when interpreting the results to understand the purchasing power of your future portfolio value.
9. Can the simulator account for regular contributions or withdrawals?
The current version of our simulator focuses on a single initial investment without considering ongoing contributions or withdrawals. For more complex scenarios involving regular cash flows, you may need to use more advanced financial planning tools or consult with a financial advisor.
10. Is the Portfolio Return Monte Carlo Simulator suitable for all types of investors?
Our simulator can be beneficial for a wide range of investors, from beginners to experienced professionals. However, it’s important to have a basic understanding of investment concepts such as returns, volatility, and risk to interpret the results effectively. For complex investment decisions or if you’re unsure about how to use the results, we recommend consulting with a qualified financial advisor.
Please note that we cannot guarantee that the webtool or results from our webtool are always correct, complete, or reliable. Our content and tools might have mistakes, biases, or inconsistencies.
Conclusion: Empowering Your Investment Decisions
The Portfolio Return Monte Carlo Simulator is a powerful tool that can significantly enhance your investment decision-making process. By providing insights into potential outcomes across thousands of simulated scenarios, it allows you to:
Assess and manage investment risks more effectively
Set realistic performance expectations
Optimize your asset allocation strategy
Make more informed long-term financial plans
Understand the trade-offs between risk and return in your portfolio
While the simulator is a valuable resource, it’s important to remember that it should be used as part of a comprehensive approach to investment planning. Consider combining the insights gained from this tool with other forms of analysis and, when necessary, seek advice from qualified financial professionals.
We encourage you to take advantage of this powerful Portfolio Return Monte Carlo Simulator to gain deeper insights into your investment strategy. By understanding the range of potential outcomes and the probabilities associated with them, you can make more confident and informed decisions about your financial future.
Start using the simulator today and take the first step towards optimizing your investment strategy for long-term success!
Important Disclaimer
The calculations, results, and content provided by our tools are not guaranteed to be accurate, complete, or reliable. Users are responsible for verifying and interpreting the results. Our content and tools may contain errors, biases, or inconsistencies. We reserve the right to save inputs and outputs from our tools for the purposes of error debugging, bias identification, and performance improvement. External companies providing AI models used in our tools may also save and process data in accordance with their own policies. By using our tools, you consent to this data collection and processing. We reserve the right to limit the usage of our tools based on current usability factors. By using our tools, you acknowledge that you have read, understood, and agreed to this disclaimer. You accept the inherent risks and limitations associated with the use of our tools and services.