Price to Earning Ratio Calculator
Is this tool helpful?
How to use the tool
- Enter Share Price — type the current market price, e.g., 88.90 or 150.25.
- Enter Earnings Per Share (EPS) — add positive EPS, e.g., 5.10 or 2.75.
- Click “Calculate” — the script checks both values are positive numbers.
- Read the P/E Ratio — result appears instantly, rounded to two decimals for clarity.
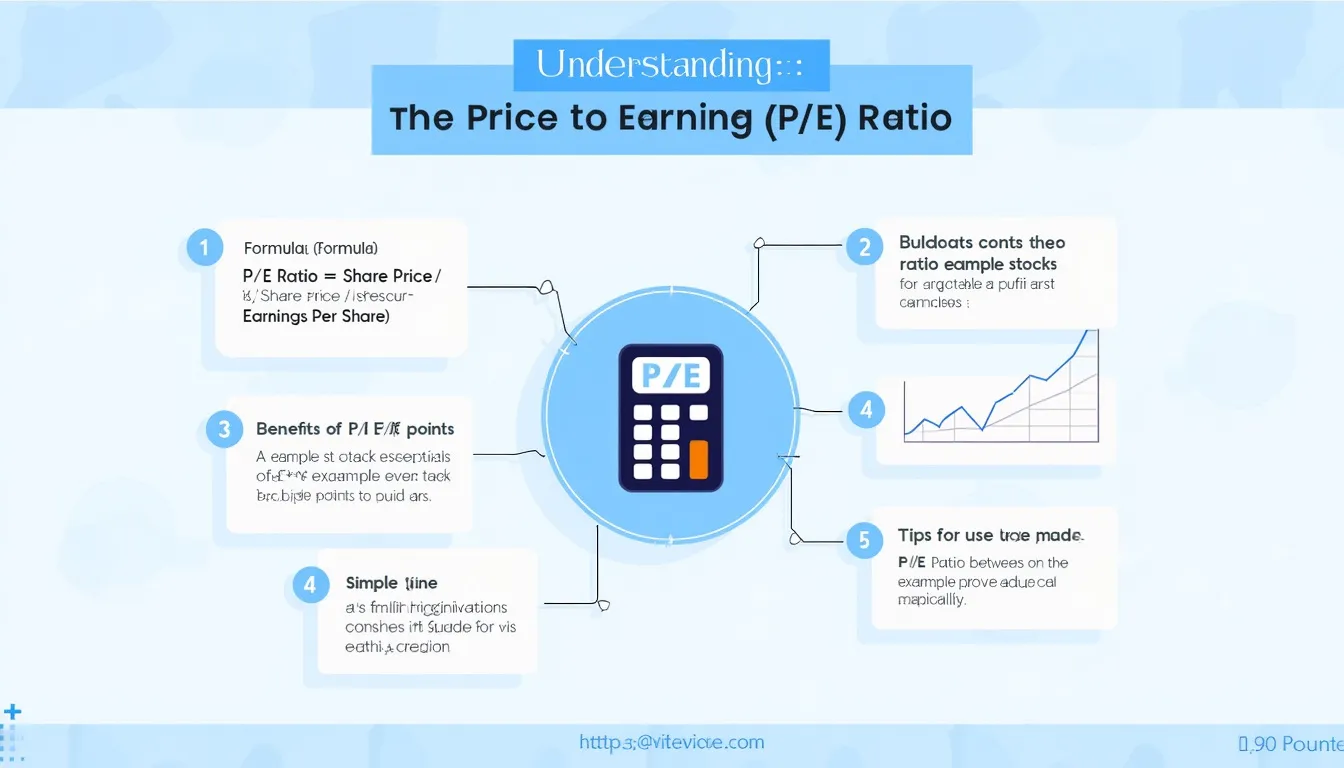
Formula
Price-to-Earnings compares price to profit:
$$ P/E = \frac{Share\;Price}{Earnings\;Per\;Share} $$
Example calculations
- Example A: $88.90 ÷ $5.10 = 17.43
- Example B: $150.25 ÷ $2.75 = 54.64
Quick-Facts
- P/E below 15 is generally viewed as “value” territory (Damodaran, 2023).
- S&P 500 averaged a P/E of 24.6 in 2022 (Siblis Research, 2023).
- P/E is undefined when EPS is negative (Investopedia, https://www.investopedia.com/terms/p/price-earningsratio.asp).
- Tool accepts share prices up to $1,000,000 and EPS up to $10,000.
What is a P/E ratio?
The P/E ratio shows how many dollars you pay for each dollar a company earns, linking market sentiment to actual profit (Investopedia, link).
How does the calculator work?
JavaScript captures your inputs, validates positivity, divides price by EPS, then displays the ratio in under 0.5 seconds using basic arithmetic—no data leaves your browser.
Why must EPS be positive?
P/E loses meaning if earnings are negative because the denominator turns the metric negative or infinite; analysts switch to price-to-sales in such cases (Morningstar, 2022).
Is rounding acceptable for analysis?
Two-decimal rounding suffices for screening; in valuation models use full precision to avoid compounding error (Aswath Damodaran, NYU lecture notes, 2023).
How do I compare two stocks?
Calculate each P/E, then favor the lower figure when earnings quality and growth prospects are similar; always confirm with sector averages (Standard & Poor’s, 2023).
What counts as a “high” P/E?
Anything above the industry’s 75th percentile suggests optimism; tech averaged 32.1 while utilities averaged 18.4 in 2022 (FactSet, 2023).
Expert tip
“A low P/E without growth is a value trap, not a bargain” — CFA Institute Equity Research Guide (2021).
Important Disclaimer
The calculations, results, and content provided by our tools are not guaranteed to be accurate, complete, or reliable. Users are responsible for verifying and interpreting the results. Our content and tools may contain errors, biases, or inconsistencies. Do not enter personal data, sensitive information, or personally identifiable information in our web forms or tools. Such data entry violates our terms of service and may result in unauthorized disclosure to third parties. We reserve the right to save inputs and outputs from our tools for the purposes of error debugging, bias identification, and performance improvement. External companies providing AI models used in our tools may also save and process data in accordance with their own policies. By using our tools, you consent to this data collection and processing. We reserve the right to limit the usage of our tools based on current usability factors.