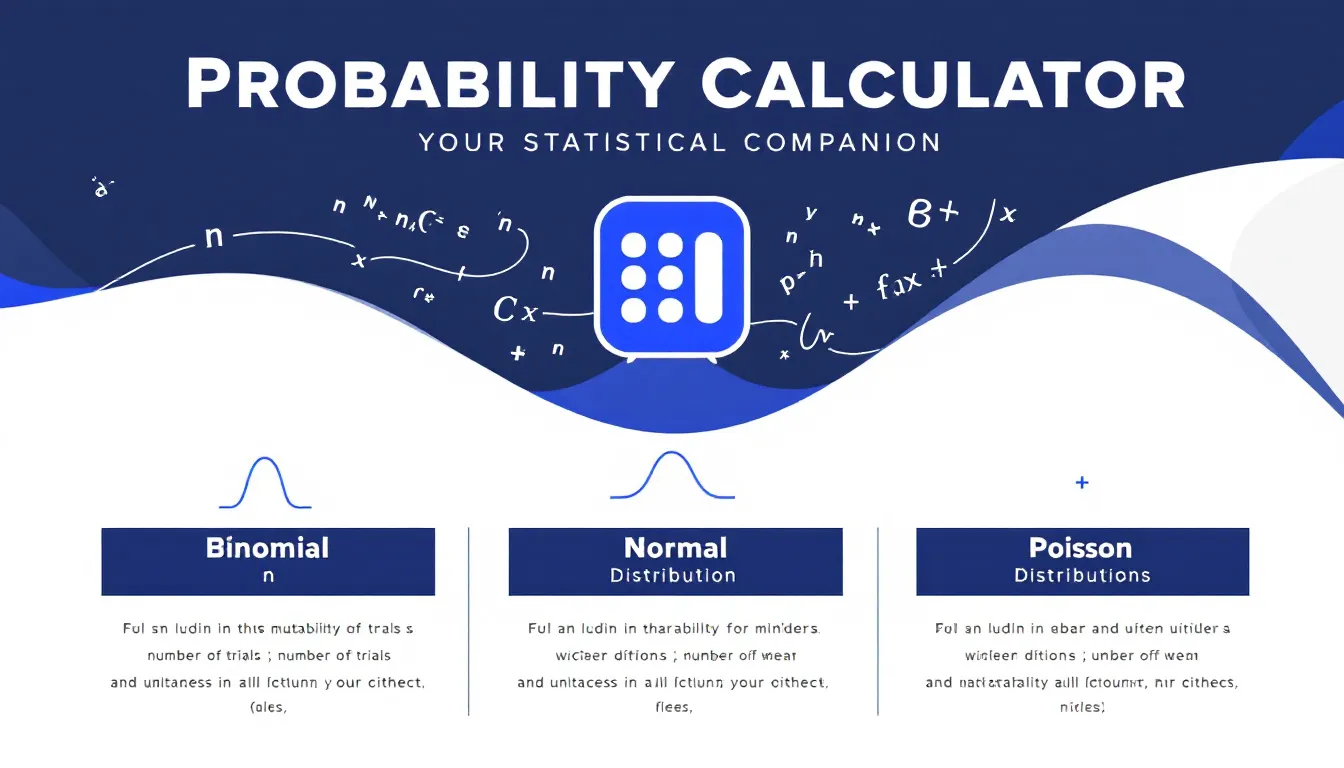
Probability Calculator
How to Use the Probability Calculator Effectively
Our Probability Calculator is a powerful tool designed to help you calculate probabilities for various statistical scenarios. Follow these steps to use the calculator effectively:
- Select the Distribution: Choose from Binomial, Normal, or Poisson distribution using the dropdown menu.
- Enter Parameters: Input the required parameters for your chosen distribution.
- Calculate: Click the “Calculate Probability” button to get your result.
- Interpret Results: View the calculated probability and the graphical representation of the distribution.
Binomial Distribution
For the Binomial Distribution, you’ll need to provide:
- Number of Trials (n): Enter the total number of independent trials. For example, 15 coin tosses.
- Probability of Success (p): Input the probability of success on a single trial. For instance, 0.6 for a biased coin.
- Number of Successes (k): Specify the number of successes you want to calculate the probability for. For example, 8 successes.
Normal Distribution
For the Normal Distribution, provide:
- Mean (μ): Enter the average value of the distribution. For example, 75 for test scores.
- Standard Deviation (σ): Input the standard deviation. For instance, 12 for the spread of test scores.
- Value (X): Specify the value to calculate the cumulative probability for. For example, 85 to find the probability of scoring 85 or less.
Poisson Distribution
For the Poisson Distribution, you’ll need:
- Average Rate (λ): Enter the mean number of occurrences in the interval. For example, 3.5 for average customer arrivals per hour.
- Number of Occurrences (k): Input the specific number of occurrences to calculate the probability for. For instance, 5 customers in an hour.
Introduction to the Probability Calculator
Probability plays a crucial role in various fields, from statistics and data science to finance and engineering. Our Probability Calculator is a versatile tool designed to simplify complex probability calculations for different statistical distributions. Whether you’re a student, researcher, or professional, this calculator helps you quickly compute probabilities, saving time and reducing the risk of manual calculation errors.
Purpose and Benefits
The primary purpose of this Probability Calculator is to provide accurate and efficient probability calculations for Binomial, Normal, and Poisson distributions. These distributions are fundamental in statistics and probability theory, each serving specific scenarios:
- Binomial Distribution: Ideal for situations with a fixed number of independent trials, each with the same probability of success.
- Normal Distribution: Widely used for continuous variables that cluster around a mean, such as heights, weights, or test scores.
- Poisson Distribution: Perfect for modeling the number of events occurring in a fixed interval of time or space.
By offering these three distributions in one tool, we cater to a wide range of probability calculation needs, making it an invaluable resource for various applications.
Benefits of Using the Probability Calculator
1. Time-Saving and Efficiency
Manual probability calculations can be time-consuming and prone to errors, especially for complex distributions. Our calculator automates these processes, allowing you to obtain results in seconds. This efficiency is particularly beneficial for:
- Students working on statistics homework or preparing for exams
- Researchers analyzing large datasets
- Professionals making data-driven decisions in business or finance
2. Accuracy and Reliability
The Probability Calculator uses precise mathematical formulas to compute probabilities, ensuring high accuracy in results. This reliability is crucial for:
- Academic research where precision is paramount
- Business analytics where decisions are based on statistical insights
- Quality control processes in manufacturing
3. Educational Tool
Beyond its practical applications, the calculator serves as an excellent educational tool. It helps users:
- Visualize probability distributions through interactive graphs
- Understand the impact of changing parameters on probability outcomes
- Reinforce theoretical concepts with practical examples
4. Versatility
By incorporating three key distributions, the calculator offers versatility for various scenarios:
- Binomial for discrete, binary outcome events
- Normal for continuous, symmetric distributions
- Poisson for rare event occurrences
5. User-Friendly Interface
The intuitive design of the calculator makes it accessible to users with varying levels of statistical knowledge. Features include:
- Clear input fields with helpful descriptions
- Instant results display
- Visual representation of the distribution
Addressing User Needs and Solving Problems
The Probability Calculator addresses several key user needs and solves specific problems in probability calculations:
1. Simplifying Complex Calculations
Problem: Many users find manual probability calculations challenging, especially for distributions with complex formulas.
Solution: Our calculator automates these calculations, requiring only basic input parameters. For example, in a Binomial Distribution scenario:
$$P(X = k) = \binom{n}{k} p^k (1-p)^{n-k}$$Instead of manually computing this formula, users simply input n, p, and k to get the result instantly.
2. Visualizing Probability Distributions
Problem: Understanding the shape and characteristics of probability distributions can be difficult without visual aids.
Solution: The calculator provides graphical representations of each distribution, helping users visualize concepts like probability density and cumulative probability.
3. Handling Different Types of Data
Problem: Users often encounter various types of data that require different probability models.
Solution: By offering Binomial, Normal, and Poisson distributions, the calculator caters to a wide range of data types and scenarios.
Example Calculations
Binomial Distribution Example
Scenario: A basketball player has a 70% free throw success rate. What’s the probability of making exactly 8 out of 10 free throws?
Inputs:
- Number of Trials (n) = 10
- Probability of Success (p) = 0.70
- Number of Successes (k) = 8
Result: The probability is approximately 0.2335 or 23.35%
Normal Distribution Example
Scenario: IQ scores are normally distributed with a mean of 100 and a standard deviation of 15. What percentage of the population has an IQ above 120?
Inputs:
- Mean (μ) = 100
- Standard Deviation (σ) = 15
- Value (X) = 120
Result: The calculator would show that approximately 9.18% of the population has an IQ above 120.
Poisson Distribution Example
Scenario: A call center receives an average of 4 calls per minute. What’s the probability of receiving exactly 6 calls in a given minute?
Inputs:
- Average Rate (λ) = 4
- Number of Occurrences (k) = 6
Result: The probability is approximately 0.1042 or 10.42%
Practical Applications of the Probability Calculator
The versatility of our Probability Calculator makes it valuable across various fields and scenarios. Here are some practical applications:
1. Business and Finance
- Risk Assessment: Use the Normal Distribution to model potential investment returns and assess risk levels.
- Quality Control: Apply the Binomial Distribution to predict defect rates in manufacturing processes.
- Customer Behavior: Utilize the Poisson Distribution to model customer arrivals or service requests.
2. Healthcare and Medical Research
- Clinical Trials: Use the Binomial Distribution to calculate the probability of treatment success rates.
- Epidemiology: Apply the Poisson Distribution to model the occurrence of rare diseases in a population.
- Diagnostic Tests: Utilize the Normal Distribution to analyze the distribution of health indicators in a population.
3. Education and Research
- Test Score Analysis: Use the Normal Distribution to understand the distribution of student scores.
- Research Outcomes: Apply the Binomial Distribution to analyze success rates in repeated experiments.
- Literature Reviews: Utilize the Poisson Distribution to model the occurrence of specific themes or citations in academic papers.
4. Environmental Science
- Weather Forecasting: Use the Normal Distribution to model temperature variations.
- Ecological Studies: Apply the Poisson Distribution to model the occurrence of rare species in a habitat.
- Pollution Monitoring: Utilize the Binomial Distribution to assess the probability of exceeding pollution thresholds.
5. Sports Analytics
- Player Performance: Use the Binomial Distribution to analyze success rates in specific skills (e.g., free throws in basketball).
- Game Outcomes: Apply the Normal Distribution to model point differentials in close games.
- Rare Events: Utilize the Poisson Distribution to model the occurrence of exceptional performances or records.
Real-World Example: Insurance Risk Assessment
An insurance company wants to assess the risk of multiple claims from a single policyholder in a year. They know that, on average, a policyholder files 1.5 claims per year.
Using the Poisson Distribution in our calculator:
- Average Rate (λ) = 1.5
- Number of Occurrences (k) = 3 (assessing the risk of 3 or more claims)
The calculator would show that the probability of a policyholder filing 3 or more claims in a year is approximately 0.1911 or 19.11%. This information helps the insurance company in pricing policies and managing their risk exposure.
Frequently Asked Questions (FAQ)
1. What is the difference between Binomial, Normal, and Poisson distributions?
Binomial Distribution is used for a fixed number of independent trials with two possible outcomes. Normal Distribution is for continuous data that clusters around a mean. Poisson Distribution models the number of events in a fixed interval where events occur at a constant rate.
2. How do I know which distribution to use for my data?
Choose Binomial for discrete events with fixed trials and success/failure outcomes. Use Normal for continuous data that’s symmetrically distributed around a mean. Opt for Poisson when dealing with the number of occurrences of an event over a fixed period or space.
3. Can this calculator handle large numbers?
Yes, our calculator is designed to handle a wide range of values, including large numbers, for all three distributions.
4. Is it possible to calculate cumulative probabilities?
For the Normal Distribution, the calculator provides cumulative probabilities. For Binomial and Poisson, you can calculate cumulative probabilities by summing individual probabilities up to your desired value.
5. How can I interpret the graphs provided with the results?
The graphs visually represent the probability distribution. For Binomial and Poisson, bar heights show probabilities for each outcome. For Normal, the curve shows the probability density, with shaded areas representing cumulative probabilities.
6. Can this calculator be used for hypothesis testing?
While primarily designed for probability calculations, the results can be used in hypothesis testing. For instance, you can use the Normal Distribution to find p-values for z-tests.
7. How accurate are the calculations?
Our calculator uses precise mathematical formulas and advanced computational methods to ensure high accuracy in results.
8. Can I use this calculator for my homework or academic research?
Absolutely! The calculator is an excellent tool for educational purposes, helping students understand probability concepts and verify manual calculations.
9. Are there any prerequisites for using this calculator effectively?
Basic understanding of probability concepts and the specific distribution you’re working with is helpful. However, the tool is designed to be user-friendly even for those new to probability theory.
10. How often is the calculator updated?
We regularly update our calculator to ensure accuracy, improve user experience, and add new features based on user feedback and advancements in statistical methods.
By addressing these common questions, we aim to provide users with a comprehensive understanding of our Probability Calculator, enhancing its utility across various applications and user levels.
Is this tool helpful?
Important Disclaimer
The calculations, results, and content provided by our tools are not guaranteed to be accurate, complete, or reliable. Users are responsible for verifying and interpreting the results. Our content and tools may contain errors, biases, or inconsistencies. We reserve the right to save inputs and outputs from our tools for the purposes of error debugging, bias identification, and performance improvement. External companies providing AI models used in our tools may also save and process data in accordance with their own policies. By using our tools, you consent to this data collection and processing. We reserve the right to limit the usage of our tools based on current usability factors. By using our tools, you acknowledge that you have read, understood, and agreed to this disclaimer. You accept the inherent risks and limitations associated with the use of our tools and services.


