Is this tool helpful?
How to Use the Product Portfolio Diversification Calculator Effectively
This tool helps you analyze the diversification of your product portfolio by examining revenues, expected returns, and risk levels. Follow these steps to use it efficiently:
- Product Name: Enter clear names for each product, such as “Smart Home Speaker Z3” or “Organic Skincare Line”.
- Revenue (USD): Provide the annual revenue for each product, for example, $450,000 for a consumer electronics product or $1,200,000 for a boutique beauty brand.
- Expected Return (%): Input the projected return percentage on each product, like 10.2% for a mid-range electronics item or 6.7% for an established skincare line.
- Risk – Standard Deviation (%): Specify the risk level based on historical variability, such as 15.4% for newer tech devices or 8.1% for mature consumer products.
Click “Add Product” to include more products in your evaluation. Once all relevant items are entered, select “Calculate” to view your portfolio’s diversification score, expected return, risk metrics, and corresponding charts.
What Is the Product Portfolio Diversification Calculator?
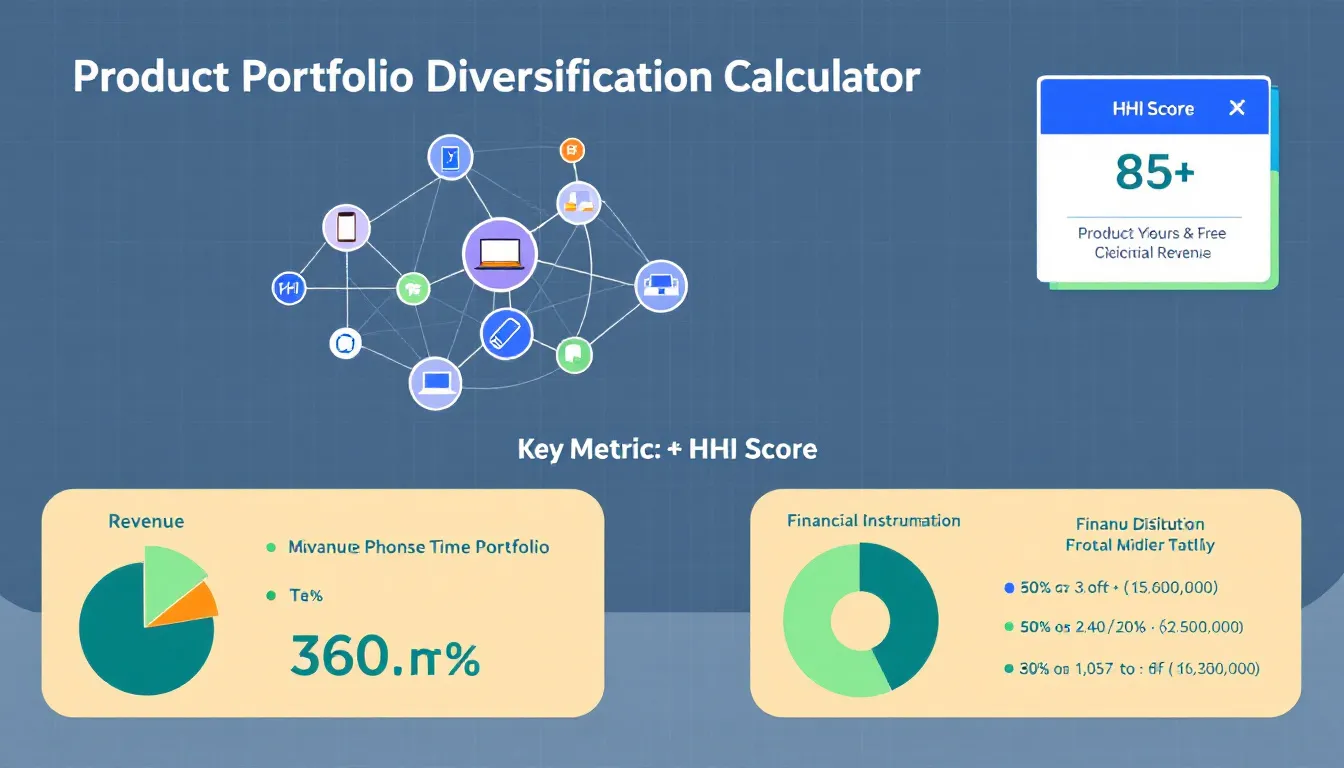
This calculator evaluates how well your product revenue streams spread risk and return. By combining financial inputs for each product, it helps you understand your portfolio’s concentration and highlight opportunities or risks.
Using core financial concepts like the Herfindahl-Hirschman Index (HHI) and portfolio theory, the tool quantifies diversification beyond surface-level observations. This insight supports better decision-making around investment, risk management, and growth planning.
Core Benefits:
- Visualizes revenue distribution across products to identify concentration risks.
- Calculates expected portfolio returns by weighting individual product performance.
- Measures portfolio risk using standard deviation, highlighting volatility exposure.
- Supports strategic portfolio adjustments through clear, actionable metrics.
- Generates graphs that simplify complex financial data for quick insights.
Example Calculations With the Portfolio Calculator
Imagine your business has three products with these details:
- Wireless Earbuds: Revenue $1,000,000 | Expected Return 11.5% | Risk 14.0%
- Fitness Tracker: Revenue $600,000 | Expected Return 9.0% | Risk 12.0%
- Smartwatch: Revenue $400,000 | Expected Return 13.0% | Risk 18.0%
The calculator will perform these key computations:
1. Diversification Score (HHI)
The Herfindahl-Hirschman Index (HHI) measures revenue concentration:
$$ \text{HHI} = \sum_{i=1}^{N} (S_i)^2 $$where ( S_i ) is the share of product ( i ) in total revenue.
2. Portfolio Expected Return
Calculated by weighting each product’s return by its revenue share:
$$ \text{Portfolio Expected Return} = \sum_{i=1}^N w_i E(R_i) $$where ( w_i ) is product ( i )’s weight and ( E(R_i) ) its expected return.
3. Portfolio Risk
Simplified as the weighted square root of variance assuming zero correlation:
$$ \text{Portfolio Risk} = \sqrt{\sum_{i=1}^N w_i^2 \sigma_i^2} $$Here, ( sigma_i ) denotes product ( i )’s standard deviation (risk).
Using the inputs, the tool calculates and displays a diversification score, expected return, and risk percentage, giving you a snapshot of your portfolio’s balance between risk and reward.
Understanding Product Portfolio Diversification and Its Impact
Product portfolio diversification manages business risk by spreading investments over multiple products. It reduces dependence on any single product’s performance, promoting stability and growth.
The calculator uses the HHI metric to quantify concentration:
- HHI below 0.15: Well-diversified portfolio with low concentration risk.
- HHI between 0.15 and 0.25: Moderately concentrated portfolio.
- HHI above 0.25: Highly concentrated portfolio vulnerable to product-specific risks.
By balancing expected returns against risk, the tool helps you optimize your product mix to improve overall portfolio health.
Practical Applications for Business and Product Managers
Startup Product Planning
As a startup, you can use this calculator to:
- Evaluate initial product lineup decisions.
- Plan the timing and order of product launches.
- Prioritize investment towards products with balanced risk and return.
Enterprise Portfolio Management
Larger organizations benefit by:
- Conducting regular portfolio reviews to track product performance.
- Identifying concentration risks that affect revenue stability.
- Assessing which product lines deserve increased investment or divestment.
Frequently Asked Questions About Product Portfolio Diversification
What is a good diversification score (HHI)?
An HHI below 0.15 means your portfolio spreads revenue well across products. Scores above 0.25 suggest you rely heavily on one or two products, which increases risk.
How often should I analyze my product portfolio?
Analyze your portfolio quarterly or whenever you launch new products or experience market shifts to keep risk and return balanced.
Can I compare products from different industries?
Yes, the calculator supports diverse products, making it useful for businesses operating across multiple sectors.
How is risk calculated?
Risk is measured by standard deviation, reflecting how much a product’s returns fluctuate over time.
What does the risk-return scatter plot show?
Products in the upper-left section have better risk-adjusted returns. If a product clusters in the lower-right, it might need reassessment.
Can I save or export my results?
While the tool doesn’t save data, you can screenshot or export charts for future reference.
How do I estimate expected returns for new products?
Use industry benchmarks, competitor data, and market research to develop reasonable expected return assumptions.
Using Portfolio Insights for Strategic Decision-Making
The calculator supports key strategic areas by helping you:
- Identify product gaps: Spot areas where your portfolio lacks exposure or diversity.
- Optimize resource allocation: Direct investments toward products with the best risk-return profile.
- Manage portfolio risk: Balance volatile products with stable ones for steady growth.
- Enhance market positioning: Understand competitive advantages through portfolio composition.
- Plan growth initiatives: Target a portfolio mix that meets long-term goals.
Monitoring and Adjusting Performance Over Time
Regular use of this calculator enables you to:
- Spot rising concentration risks quickly.
- Rebalance your product mix proactively.
- Track performance trends for informed adjustments.
- Ensure strategic goals align with portfolio structure.
Important Disclaimer
The calculations, results, and content provided by our tools are not guaranteed to be accurate, complete, or reliable. Users are responsible for verifying and interpreting the results. Our content and tools may contain errors, biases, or inconsistencies. Do not enter personal data, sensitive information, or personally identifiable information in our web forms or tools. Such data entry violates our terms of service and may result in unauthorized disclosure to third parties. We reserve the right to save inputs and outputs from our tools for the purposes of error debugging, bias identification, and performance improvement. External companies providing AI models used in our tools may also save and process data in accordance with their own policies. By using our tools, you consent to this data collection and processing. We reserve the right to limit the usage of our tools based on current usability factors.


