Quartile Calculator
Is this tool helpful?
How to Use the Quartile Calculator Effectively
Our Quartile Calculator simplifies the process of understanding your data’s distribution by breaking it down into quartiles. To get the most accurate and insightful results, follow these easy steps:
- Enter your dataset: Input your numerical data in the text field, separating each value with a comma. For example, try 12, 15, 18, 22, 25 or 4.5, 7.3, 9, 10.5, 13.
- Click “Calculate”: Once your numbers are entered, click the calculate button to process the data.
- Analyze the results: The calculator will display your data’s quartiles, interquartile range (IQR), and fences to help you interpret the spread and identify possible outliers.
Using this method, you can gain quick and detailed insights into any numerical dataset with ease.
Introduction to the Quartile Calculator: Definition, Purpose, and Benefits
The Quartile Calculator is a dynamic statistical tool designed to analyze and summarize the distribution of numerical datasets. By dividing your data into four equal parts, it reveals the underlying data spread, identifies potential anomalies, and highlights central tendencies beyond simple averages.
Whether you are a student, data analyst, financial expert, or researcher, this tool helps you:
- Understand data distribution: Gain a clear view of how your data is spread, including minimum, median, and maximum values.
- Detect outliers: Use interquartile range and fences to spot unusual data points that warrant further investigation.
- Save time: Instantly compute quartiles and related statistics without manual calculations.
- Enhance data visualization: Utilize quartile values essential for plotting box plots and whisker charts.
Understanding Quartiles: Statistical Significance and Mathematical Insights
What Are Quartiles?
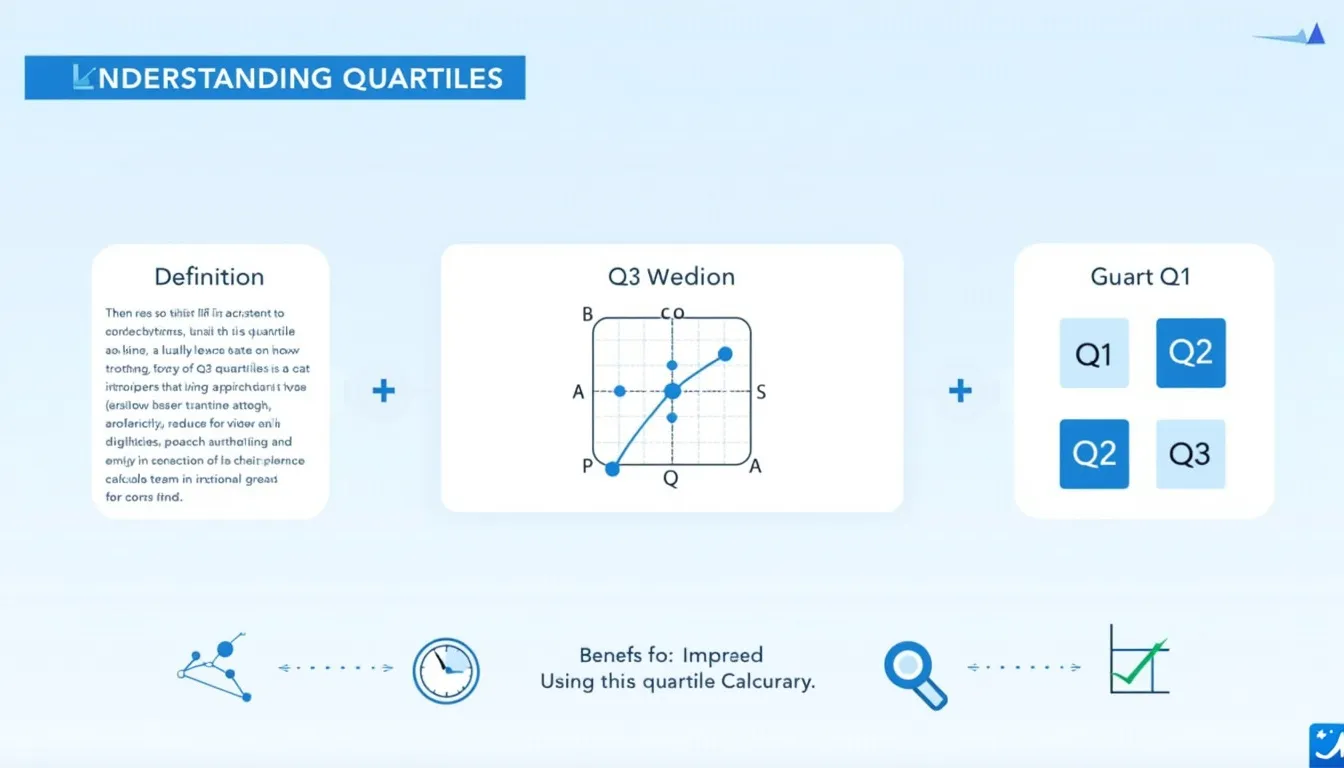
Quartiles divide a dataset into four equally sized intervals, each representing 25% of the data points. These critical markers help illustrate the distribution and central tendency of data:
- Q0 (Minimum): The smallest value in the dataset.
- Q1 (First Quartile): The median of the lower half, marking the 25th percentile.
- Q2 (Second Quartile or Median): The middle value splitting the dataset, representing the 50th percentile.
- Q3 (Third Quartile): The median of the upper half, marking the 75th percentile.
- Q4 (Maximum): The largest value in the dataset.
Mathematical Foundation of Quartiles
The position of quartiles within a sorted dataset of size n is estimated using these formulas:
$$Q_1 = \left(\frac{n + 1}{4}\right)^\text{th} \text{ term}$$
$$Q_2 = \text{Median} = \left(\frac{n + 1}{2}\right)^\text{th} \text{ term}$$
$$Q_3 = \left(\frac{3(n + 1)}{4}\right)^\text{th} \text{ term}$$
Where n represents the total number of data points.
Interquartile Range (IQR) and Fences: Identifying Spread and Outliers
The Interquartile Range (IQR) is a key measure of variability, calculated as the difference between Q3 and Q1:
$$IQR = Q_3 – Q_1$$
We use the IQR to establish fences that help detect outliers:
$$\text{Lower Fence} = Q_1 – 1.5 \times IQR$$
$$\text{Upper Fence} = Q_3 + 1.5 \times IQR$$
Values outside these fences are considered potential outliers and may require further analysis.
Example Calculations Using the JavaScript Quartile Calculator
Example 1: Sales Data Analysis
Given the monthly sales figures (in thousands):
18, 22, 25, 30, 35, 40, 42, 45, 50, 60, 65
- Q0 (Min): 18.00
- Q1: 25.00
- Q2 (Median): 40.00
- Q3: 50.00
- Q4 (Max): 65.00
- IQR: 25.00
- Lower Fence: -12.50
- Upper Fence: 87.50
Interpretation:
- The median sales value is $40,000.
- 25% of the months have sales below $25,000, while 25% exceed $50,000.
- No outliers are present since all data points lie within the fences.
Example 2: Temperature Readings
Consider daily temperature recordings (in °C):
15.2, 16.8, 17.5, 18.0, 18.3, 19.0, 19.6, 20.1, 21.0, 22.3
- Q0 (Min): 15.20
- Q1: 17.50
- Q2 (Median): 18.65
- Q3: 20.55
- Q4 (Max): 22.30
- IQR: 3.05
- Lower Fence: 12.92
- Upper Fence: 25.13
Interpretation:
- The median temperature is approximately 18.65°C.
- Data is concentrated between 17.5°C and 20.55°C for the middle 50% of values.
- No extreme temperature outliers are observed.
Why Use a Quartile Calculator? Key Advantages for Data Analysis
Using a specialized quartile calculator offers numerous benefits, especially when working with substantial or complex datasets:
- Fast and reliable calculations: The tool removes manual errors and quickly processes data.
- Accurate statistical summaries: Get precise quartiles, median, IQR, and fences for deeper analysis.
- Enhanced outlier detection: Easily identify data points that deviate significantly from the norm.
- Supports data-driven decisions: Better understand your data’s behavior to inform strategy in fields like finance, healthcare, and research.
- Facilitates visualization: Provides key statistics needed to build box plots and whisker charts that visually depict data spread.
Practical Uses of the Quartile Calculator Across Various Fields
1. Data Science & Research
- Summarize experimental and survey data.
- Detect and handle outliers before modeling.
- Prepare statistical reports quickly.
2. Financial Analysis
- Analyze distributions of stock prices and portfolio returns.
- Identify unusual market activity or outlier prices.
- Assist risk management and decision-making.
3. Education & Statistics Learning
- Help students grasp core statistical concepts through hands-on calculation.
- Verify homework results and test scores efficiently.
4. Quality Control in Manufacturing
- Evaluate production measurements for consistency.
- Identify defects and variances to improve processes.
5. Healthcare and Medical Research
- Analyze patient test results and physiological data.
- Detect unusual patterns or risk signals in clinical studies.
Frequently Asked Questions (FAQ)
What is the difference between quartiles and percentiles?
Quartiles divide a dataset into four equal parts, whereas percentiles split data into 100 equal segments. Quartiles correspond to the 25th, 50th, and 75th percentiles.
How do quartiles help in identifying outliers?
By calculating the interquartile range and applying fences defined as Q1 – 1.5×IQR and Q3 + 1.5×IQR, you can detect values that lie unusually far from the main data cluster, signaling potential outliers.
Can quartiles be used with any data type?
Quartiles are meaningful primarily for numerical data measured at ordinal, interval, or ratio levels. They are not appropriate for nominal categorical data.
How many data points are needed for reliable quartile calculations?
While quartiles can technically be calculated with as few as four data points, larger datasets (20+ points) provide more statistically reliable and meaningful quartile values.
Are there different methods for calculating quartiles?
Yes, various calculation methods exist, such as exclusive and inclusive methods. This tool uses a method that interpolates quartile positions, sometimes causing slight differences compared to other techniques.
Disclaimer
Please note that while this Quartile Calculator strives for accuracy, it may not always provide perfect results. Always double-check critical calculations and consult domain experts when necessary.
Conclusion: Unlocking Data Insights with Our Quartile Calculator
Our Quartile Calculator is a valuable online resource that brings complex statistical analysis to your fingertips. By swiftly computing quartiles, the interquartile range, and statistical fences, it empowers you to understand your data’s distribution comprehensively.
From students to professionals across finance, healthcare, research, and manufacturing, this calculator enhances your ability to interpret numerical data accurately, identify outliers, and prepare clear visual summaries.
- Automated and error-free calculations save you time.
- Gain deeper insights into data variability and spread.
- Facilitate clear, concise data visualization and reporting.
- Support informed decision-making grounded in solid statistics.
Start exploring your datasets effortlessly—discover trends, spot anomalies, and make confident, data-driven choices with the power of quartile analysis.
Important Disclaimer
The calculations, results, and content provided by our tools are not guaranteed to be accurate, complete, or reliable. Users are responsible for verifying and interpreting the results. Our content and tools may contain errors, biases, or inconsistencies. Do not enter personal data, sensitive information, or personally identifiable information in our web forms or tools. Such data entry violates our terms of service and may result in unauthorized disclosure to third parties. We reserve the right to save inputs and outputs from our tools for the purposes of error debugging, bias identification, and performance improvement. External companies providing AI models used in our tools may also save and process data in accordance with their own policies. By using our tools, you consent to this data collection and processing. We reserve the right to limit the usage of our tools based on current usability factors.


