Receivables Turnover Ratio Calculator: Measure Your Business Efficiency
Unlock the power of financial efficiency with our Receivables Turnover Ratio Calculator. Discover how this essential tool can revolutionize your cash flow management, optimize credit policies, and boost your business's financial health. Ready to take control of your accounts receivable? Learn how to harness this game-changing metric today!
Receivables Turnover Ratio Calculator
Result:
★ Add to Home Screen
×
Follow these steps:
Tap the Share button at the bottom of the browser
Scroll down and tap “Add to Home Screen”
Tap “Add” to confirm
Follow these steps:
Tap the menu icon (⋮) in the top right
Tap “Add to Home screen”
Tap “Add” to confirm
Follow these steps:
Click the menu icon (⋮) in the top right
Click “Bookmarks”
Click “Bookmark this tab” or press Ctrl+D (Cmd+D on Mac)
Is this tool helpful?
Thanks for your feedback!
Welcome to our comprehensive guide on the Receivables Turnover Ratio Calculator. This powerful tool is designed to help businesses of all sizes evaluate their efficiency in collecting accounts receivable and managing cash flow. In this article, we’ll explore how to use the calculator, its benefits, and why it’s crucial for your financial health.
How to Use the Receivables Turnover Ratio Calculator Effectively
Our user-friendly Receivables Turnover Ratio Calculator is designed to provide quick and accurate results. Here’s a step-by-step guide on how to use it:
Enter Sales Revenue: Input your total sales revenue for the period you’re analyzing. This should be the gross amount before any deductions.
Input Average Accounts Receivable: Calculate the average accounts receivable by adding the beginning and ending accounts receivable balances for the period and dividing by two. Enter this figure into the calculator.
Click Calculate: Once you’ve entered both values, click the “Calculate” button to get your Receivables Turnover Ratio.
Interpret the Results: The calculator will display your Receivables Turnover Ratio. We’ll discuss how to interpret this number later in the article.
Remember, the calculator uses the following formula to determine your ratio:
The Receivables Turnover Ratio, also known as the Accounts Receivable Turnover Ratio, is a crucial financial metric that measures how efficiently a company collects payment on its credit sales. It indicates how many times, on average, a company collects its accounts receivable during a specific period, typically a year.
What Does the Ratio Tell Us?
A higher ratio generally indicates that a company is more efficient at collecting its receivables. It suggests that the company has a good credit policy and effective collection practices. Conversely, a lower ratio might signal that the company is having difficulties collecting payments from its customers, which could lead to cash flow problems.
Interpreting the Results
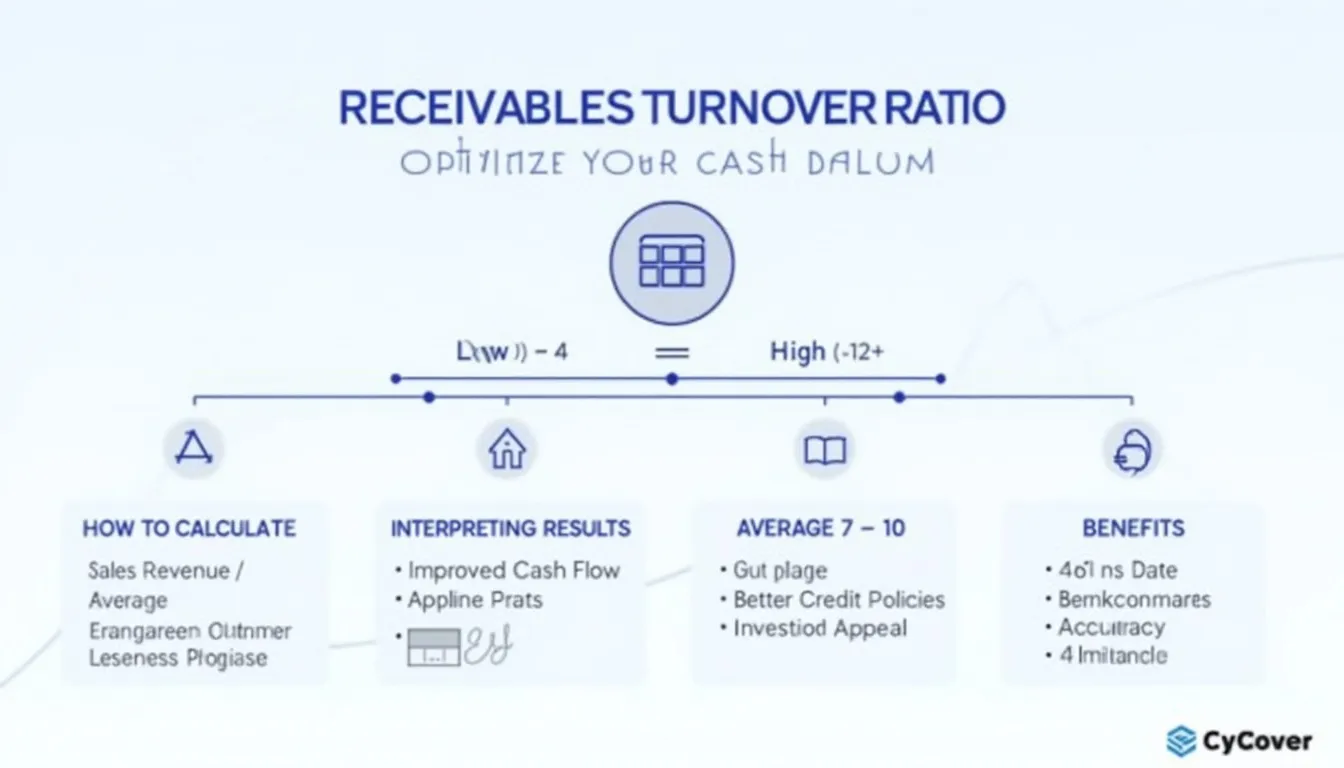
High Ratio (e.g., 12 or above): This suggests that the company is collecting its receivables quickly, which is generally positive for cash flow.
Low Ratio (e.g., 4 or below): This might indicate that the company is having trouble collecting payments, which could lead to cash flow issues.
Average Ratio: The ideal ratio varies by industry, but generally, a ratio between 7 and 10 is considered good for many businesses.
Benefits of Using the Receivables Turnover Ratio Calculator
Utilizing our Receivables Turnover Ratio Calculator offers numerous advantages for businesses:
Quick and Accurate Calculations: Our calculator eliminates the need for manual calculations, saving time and reducing the risk of errors.
Improved Cash Flow Management: By regularly monitoring your receivables turnover, you can identify trends and make informed decisions to improve cash flow.
Enhanced Credit Policy Evaluation: The ratio helps you assess the effectiveness of your credit policies and collection procedures.
Benchmarking: Compare your ratio to industry standards or your own historical data to gauge performance.
Investor and Lender Insights: A good receivables turnover ratio can make your business more attractive to potential investors and lenders.
How the Receivables Turnover Ratio Calculator Addresses User Needs
Our calculator is designed to meet the diverse needs of businesses, financial analysts, and investors. Here’s how it addresses specific user requirements:
For Business Owners and Managers
Cash Flow Optimization: By regularly calculating your receivables turnover ratio, you can identify trends in your collection efficiency and take steps to improve cash flow.
Credit Policy Adjustment: If your ratio is too low, it might indicate that your credit terms are too lenient. Conversely, if it’s too high, you might be losing sales due to overly strict credit policies.
Performance Tracking: Monitor how changes in your collection practices impact your ratio over time.
For Financial Analysts
Company Evaluation: Quickly assess a company’s efficiency in managing its accounts receivable.
Comparative Analysis: Use the calculator to compare the performance of different companies within the same industry.
Trend Analysis: Calculate the ratio for multiple periods to identify long-term trends in a company’s collection efficiency.
For Investors
Investment Decision Support: Use the ratio as one of many factors to evaluate potential investments.
Risk Assessment: A consistently low ratio might indicate higher risk due to potential cash flow issues.
Company Comparison: Compare the ratios of different companies to identify those with superior receivables management.
Practical Applications and Examples
Let’s explore some real-world scenarios to illustrate how the Receivables Turnover Ratio Calculator can be applied:
Example 1: Retail Company
Imagine a retail company with annual credit sales of $5,000,000 and average accounts receivable of $500,000.
This ratio of 10 suggests that the company collects its receivables, on average, 10 times per year. This is generally considered good for a retail business.
Example 2: Manufacturing Company
Consider a manufacturing company with annual credit sales of $20,000,000 and average accounts receivable of $5,000,000.
A ratio of 4 might be concerning for a manufacturing company, as it suggests they’re only collecting their receivables four times per year. This could indicate a need to review and tighten credit policies or improve collection practices.
Example 3: Improving Receivables Turnover
Let’s say a company calculates its receivables turnover ratio and finds it to be 6. They implement stricter credit policies and more efficient collection procedures. After a year, they recalculate:
The improvement from 6 to 10 indicates that their new policies have significantly enhanced their collection efficiency.
Frequently Asked Questions (FAQ)
1. What is a good receivables turnover ratio?
A good receivables turnover ratio varies by industry, but generally, a ratio between 7 and 10 is considered healthy for many businesses. However, it’s essential to compare your ratio to industry benchmarks for a more accurate assessment.
2. How often should I calculate my receivables turnover ratio?
It’s recommended to calculate your receivables turnover ratio at least quarterly. This allows you to track changes over time and respond quickly to any negative trends.
3. Can a receivables turnover ratio be too high?
While a high ratio generally indicates efficient collection practices, an extremely high ratio might suggest that your credit policies are too strict. This could potentially be limiting your sales to credit-worthy customers.
4. How can I improve my receivables turnover ratio?
To improve your ratio, consider:
Implementing stricter credit policies
Offering discounts for early payments
Improving your invoicing process
Following up promptly on overdue accounts
Using automated reminders for upcoming and overdue payments
5. What’s the difference between receivables turnover ratio and days sales outstanding (DSO)?
While both metrics measure collection efficiency, they provide different perspectives. The receivables turnover ratio shows how many times per year receivables are collected, while DSO measures the average number of days it takes to collect payment after a sale is made.
6. Can seasonal fluctuations affect my receivables turnover ratio?
Yes, seasonal fluctuations can impact your ratio. For businesses with significant seasonal variations, it’s often more meaningful to calculate the ratio on an annual basis or compare the same periods across different years.
7. How does the receivables turnover ratio relate to cash flow?
A higher receivables turnover ratio generally indicates better cash flow, as it suggests that the company is collecting payments more quickly. This can lead to improved liquidity and reduced need for borrowing.
8. Can I use this calculator for any type of business?
Yes, this calculator can be used for any business that extends credit to its customers. However, the interpretation of the results may vary depending on the industry and specific business model.
9. What if my company primarily deals in cash sales?
If your company primarily deals in cash sales, the receivables turnover ratio may be less relevant. In such cases, other financial metrics like inventory turnover or cash conversion cycle might be more useful.
10. How accurate is this calculator?
While our calculator is designed to provide accurate results based on the input provided, it’s important to note that we can’t guarantee that the webtool or results from our webtool are always correct, complete, or reliable. Our content and tools might have mistakes, biases, or inconsistencies. It’s always advisable to cross-check results and consult with a financial professional for important decisions.
Conclusion: Harness the Power of the Receivables Turnover Ratio Calculator
The Receivables Turnover Ratio Calculator is an invaluable tool for businesses looking to optimize their cash flow and improve their financial health. By providing quick, accurate calculations, it enables you to:
Assess your collection efficiency
Identify trends in your accounts receivable management
Make informed decisions about credit policies
Improve your overall financial performance
Remember, while the receivables turnover ratio is a powerful metric, it should be used in conjunction with other financial indicators for a comprehensive view of your business’s financial health. Regular monitoring and analysis of this ratio can lead to improved cash flow, reduced bad debts, and ultimately, a stronger, more resilient business.
Take control of your accounts receivable management today. Use our Receivables Turnover Ratio Calculator to gain valuable insights into your business’s financial efficiency and pave the way for improved cash flow and growth.
Important Disclaimer
The calculations, results, and content provided by our tools are not guaranteed to be accurate, complete, or reliable. Users are responsible for verifying and interpreting the results. Our content and tools may contain errors, biases, or inconsistencies. We reserve the right to save inputs and outputs from our tools for the purposes of error debugging, bias identification, and performance improvement. External companies providing AI models used in our tools may also save and process data in accordance with their own policies. By using our tools, you consent to this data collection and processing. We reserve the right to limit the usage of our tools based on current usability factors. By using our tools, you acknowledge that you have read, understood, and agreed to this disclaimer. You accept the inherent risks and limitations associated with the use of our tools and services.