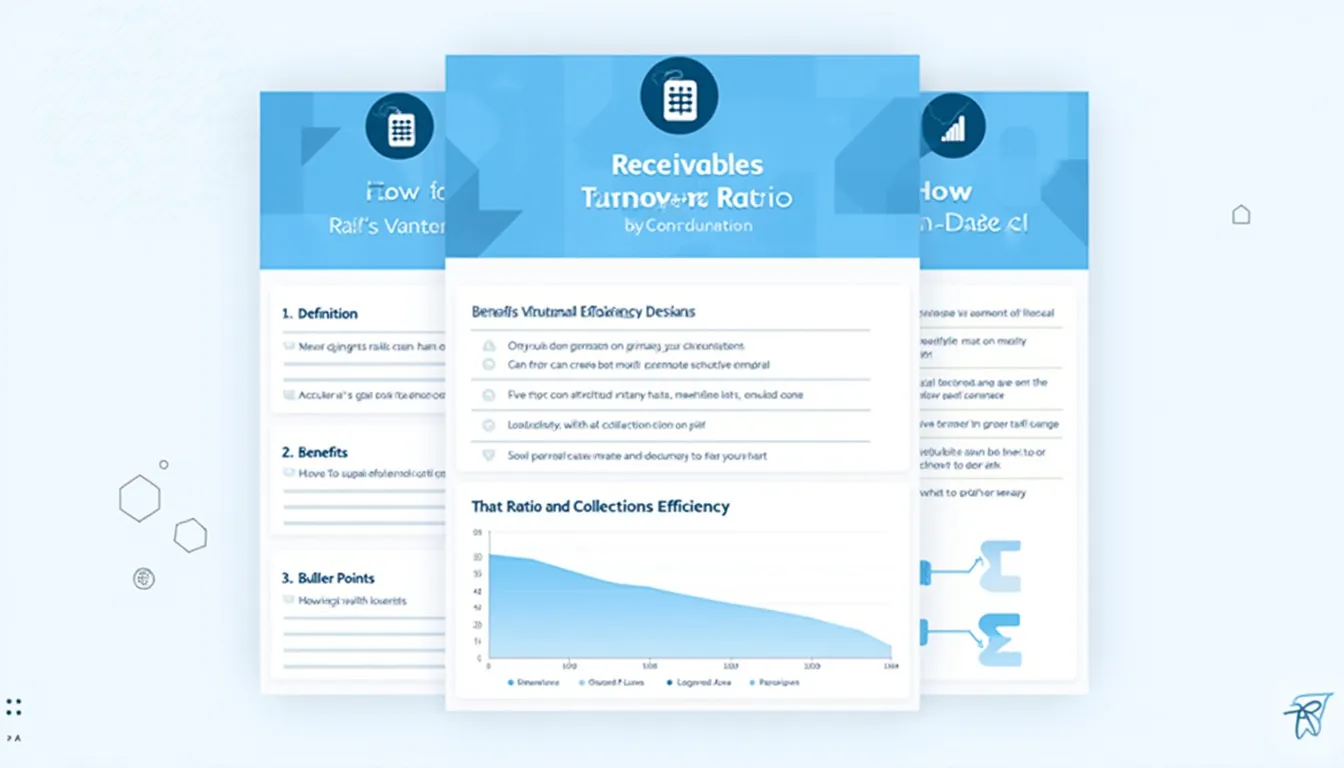
Receivables Turnover Ratio Calculator
Is this tool helpful?
Receivables Turnover Ratio Calculator: Optimize Your Business’s Cash Flow
How to Use the Receivables Turnover Ratio Calculator Effectively
Our Receivables Turnover Ratio Calculator is designed to help you quickly and accurately assess your company’s efficiency in collecting accounts receivable. Follow these simple steps to use the calculator:
- Enter your total Sales Revenue for the period in USD.
- Input your Average Accounts Receivable for the same period in USD.
- Click the “Calculate” button to generate your Receivables Turnover Ratio.
- Review the result displayed below the calculator.
The calculator will instantly provide you with your Receivables Turnover Ratio, a crucial metric for understanding your business’s financial health and efficiency in managing customer credit and collecting payments.
Understanding the Receivables Turnover Ratio: Definition, Purpose, and Benefits
The Receivables Turnover Ratio, also known as the Accounts Receivable Turnover Ratio or Debtor’s Turnover Ratio, is a vital financial metric that measures how efficiently a company collects payments from its customers who purchased goods or services on credit. This ratio provides valuable insights into a company’s ability to extend credit to customers and collect debts.
Definition
The Receivables Turnover Ratio is calculated by dividing the net credit sales by the average accounts receivable for a specific period. The formula is as follows:
$$ \text{Receivables Turnover Ratio} = \frac{\text{Net Credit Sales}}{\text{Average Accounts Receivable}} $$Where:
- Net Credit Sales: Total credit sales minus returns and allowances for the period
- Average Accounts Receivable: (Beginning Accounts Receivable + Ending Accounts Receivable) ÷ 2
Purpose
The primary purpose of calculating the Receivables Turnover Ratio is to evaluate a company’s effectiveness in extending credit and collecting debts. This ratio helps businesses and investors understand:
- How quickly customers are paying their invoices
- The efficiency of the company’s credit policies and collection processes
- The quality of the company’s customers and their ability to pay on time
- The overall liquidity and cash flow management of the business
Benefits
Understanding and monitoring your Receivables Turnover Ratio offers numerous benefits for businesses of all sizes:
- Improved Cash Flow Management: A higher ratio indicates that a company collects payments more quickly, leading to better cash flow and working capital management.
- Enhanced Credit Policy Evaluation: The ratio helps businesses assess the effectiveness of their credit policies and make necessary adjustments to optimize cash collection.
- Reduced Bad Debt Risk: By monitoring this ratio, companies can identify potential issues with customer payments early and take proactive measures to reduce the risk of bad debts.
- Competitive Advantage: A higher ratio compared to industry peers may indicate a competitive advantage in terms of operational efficiency and customer quality.
- Investor and Lender Confidence: A strong Receivables Turnover Ratio can increase investor and lender confidence in the company’s financial health and management capabilities.
Benefits of Using the Receivables Turnover Ratio Calculator
Our Receivables Turnover Ratio Calculator offers several advantages for businesses and financial professionals:
- Time-Saving: Quickly calculate your ratio without the need for manual computations or complex spreadsheets.
- Accuracy: Eliminate human error and ensure precise calculations every time.
- User-Friendly Interface: Easy-to-use design makes it accessible for users with varying levels of financial expertise.
- Instant Results: Get immediate feedback on your company’s receivables management efficiency.
- Consistency: Maintain consistent calculations across different periods or departments within your organization.
- Decision Support: Use the results to make informed decisions about credit policies and collection strategies.
- Performance Tracking: Regularly calculate and compare ratios to track improvements in your accounts receivable management over time.
Addressing User Needs and Solving Specific Problems
The Receivables Turnover Ratio Calculator addresses several key user needs and solves specific problems related to financial management and analysis:
1. Assessing Collection Efficiency
Problem: Companies struggle to determine how efficiently they are collecting payments from customers.
Solution: By inputting your sales revenue and average accounts receivable, the calculator quickly provides your Receivables Turnover Ratio. A higher ratio indicates more efficient collection practices, while a lower ratio may suggest the need for improvement in your collection processes.
2. Evaluating Credit Policies
Problem: Businesses find it challenging to assess the effectiveness of their credit policies.
Solution: Regular use of the Receivables Turnover Ratio Calculator allows you to track changes in your ratio over time. If you notice a declining ratio after implementing new credit policies, it may indicate that the policies are too lenient and need adjustment.
3. Identifying Cash Flow Issues
Problem: Companies may experience cash flow problems due to slow-paying customers but struggle to quantify the issue.
Solution: A low Receivables Turnover Ratio calculated using our tool can alert you to potential cash flow problems caused by slow collections. This early warning allows you to take proactive measures to improve cash flow, such as offering early payment discounts or tightening credit terms.
4. Benchmarking Performance
Problem: Businesses want to compare their collection efficiency against industry standards but lack a standardized metric.
Solution: The Receivables Turnover Ratio Calculator provides a consistent and widely-recognized metric that allows you to benchmark your performance against industry averages and competitors.
5. Forecasting Cash Inflows
Problem: Predicting future cash inflows from accounts receivable can be challenging without proper tools.
Solution: By regularly calculating your Receivables Turnover Ratio, you can better estimate how quickly your accounts receivable will convert to cash, aiding in more accurate cash flow forecasting and budgeting.
Practical Applications and Examples
To illustrate the practical applications of the Receivables Turnover Ratio Calculator, let’s explore some real-world examples:
Example 1: Retail Company
A retail company, ABC Stores, has annual credit sales of $5,000,000 and average accounts receivable of $500,000.
Using the calculator:
- Sales Revenue: $5,000,000
- Average Accounts Receivable: $500,000
- Calculated Receivables Turnover Ratio: 10
Interpretation: ABC Stores collects its receivables 10 times per year, or approximately every 36.5 days (365 days ÷ 10). This indicates relatively efficient collection practices for a retail business.
Example 2: Manufacturing Company
XYZ Manufacturing has annual credit sales of $20,000,000 and average accounts receivable of $4,000,000.
Using the calculator:
- Sales Revenue: $20,000,000
- Average Accounts Receivable: $4,000,000
- Calculated Receivables Turnover Ratio: 5
Interpretation: XYZ Manufacturing collects its receivables 5 times per year, or every 73 days (365 days ÷ 5). This lower ratio might be typical for a manufacturing company with longer payment terms but could also indicate room for improvement in collection efficiency.
Example 3: Service-Based Business
123 Consulting Services has annual credit sales of $1,000,000 and average accounts receivable of $50,000.
Using the calculator:
- Sales Revenue: $1,000,000
- Average Accounts Receivable: $50,000
- Calculated Receivables Turnover Ratio: 20
Interpretation: 123 Consulting Services collects its receivables 20 times per year, or every 18.25 days (365 days ÷ 20). This high ratio indicates very efficient collection practices, which is often crucial for service-based businesses to maintain healthy cash flow.
Frequently Asked Questions (FAQ)
1. What is a good Receivables Turnover Ratio?
A “good” Receivables Turnover Ratio varies by industry and business model. Generally, a higher ratio is better as it indicates more efficient collection of receivables. However, an extremely high ratio might suggest overly strict credit policies that could be limiting sales. It’s best to compare your ratio to industry averages and your own historical performance.
2. How often should I calculate my Receivables Turnover Ratio?
It’s recommended to calculate your Receivables Turnover Ratio at least quarterly, but monthly calculations can provide more timely insights into your collection efficiency. Regular monitoring allows you to identify trends and address issues promptly.
3. Can a low Receivables Turnover Ratio be good?
While generally a higher ratio is preferred, a lower ratio isn’t always bad. In some industries with longer payment cycles or for businesses that use generous credit terms as a competitive advantage, a lower ratio might be acceptable. However, it’s crucial to ensure that the lower ratio doesn’t negatively impact cash flow or profitability.
4. How can I improve my Receivables Turnover Ratio?
To improve your Receivables Turnover Ratio, consider:
- Tightening credit policies for new customers
- Offering early payment discounts
- Implementing more efficient invoicing and follow-up procedures
- Using automated payment reminders
- Considering factoring or invoice financing for problematic accounts
5. How does the Receivables Turnover Ratio relate to the Average Collection Period?
The Receivables Turnover Ratio and Average Collection Period are inversely related. To calculate the Average Collection Period, divide 365 days by the Receivables Turnover Ratio. For example, if your Receivables Turnover Ratio is 10, your Average Collection Period is 36.5 days (365 ÷ 10).
6. Can the Receivables Turnover Ratio be too high?
While a high ratio generally indicates efficient collection practices, an extremely high ratio might suggest that your credit policies are too strict. This could potentially limit sales growth by discouraging customers who might prefer more lenient credit terms.
7. How does seasonality affect the Receivables Turnover Ratio?
Seasonal fluctuations in sales can significantly impact the Receivables Turnover Ratio. For businesses with strong seasonal patterns, it’s often more meaningful to calculate and compare ratios for the same periods across different years rather than consecutive quarters.
Please note that while we strive for accuracy and reliability, we cannot guarantee that the results from our webtool are always correct, complete, or reliable. Our content and tools might have mistakes, biases, or inconsistencies. Always use professional judgment and consult with financial experts when making important business decisions.
Conclusion: Empowering Financial Decision-Making
The Receivables Turnover Ratio Calculator is an invaluable tool for businesses seeking to optimize their accounts receivable management and improve overall financial health. By providing quick, accurate calculations of this crucial metric, our calculator empowers you to:
- Assess and improve collection efficiency
- Evaluate and refine credit policies
- Identify and address potential cash flow issues
- Benchmark performance against industry standards
- Make informed decisions about credit management strategies
Regular use of this calculator, combined with a thorough understanding of the Receivables Turnover Ratio, can lead to significant improvements in your business’s financial management practices. By staying on top of this key metric, you can ensure healthier cash flows, reduce bad debt risks, and ultimately drive greater profitability for your organization.
Take control of your accounts receivable management today – use our Receivables Turnover Ratio Calculator to gain valuable insights into your business’s financial efficiency and pave the way for smarter, data-driven decision-making.
Ready to optimize your receivables management?
Start using our Receivables Turnover Ratio Calculator now and take the first step towards improved financial health and efficiency for your business!
Important Disclaimer
The calculations, results, and content provided by our tools are not guaranteed to be accurate, complete, or reliable. Users are responsible for verifying and interpreting the results. Our content and tools may contain errors, biases, or inconsistencies. We reserve the right to save inputs and outputs from our tools for the purposes of error debugging, bias identification, and performance improvement. External companies providing AI models used in our tools may also save and process data in accordance with their own policies. By using our tools, you consent to this data collection and processing. We reserve the right to limit the usage of our tools based on current usability factors. By using our tools, you acknowledge that you have read, understood, and agreed to this disclaimer. You accept the inherent risks and limitations associated with the use of our tools and services.