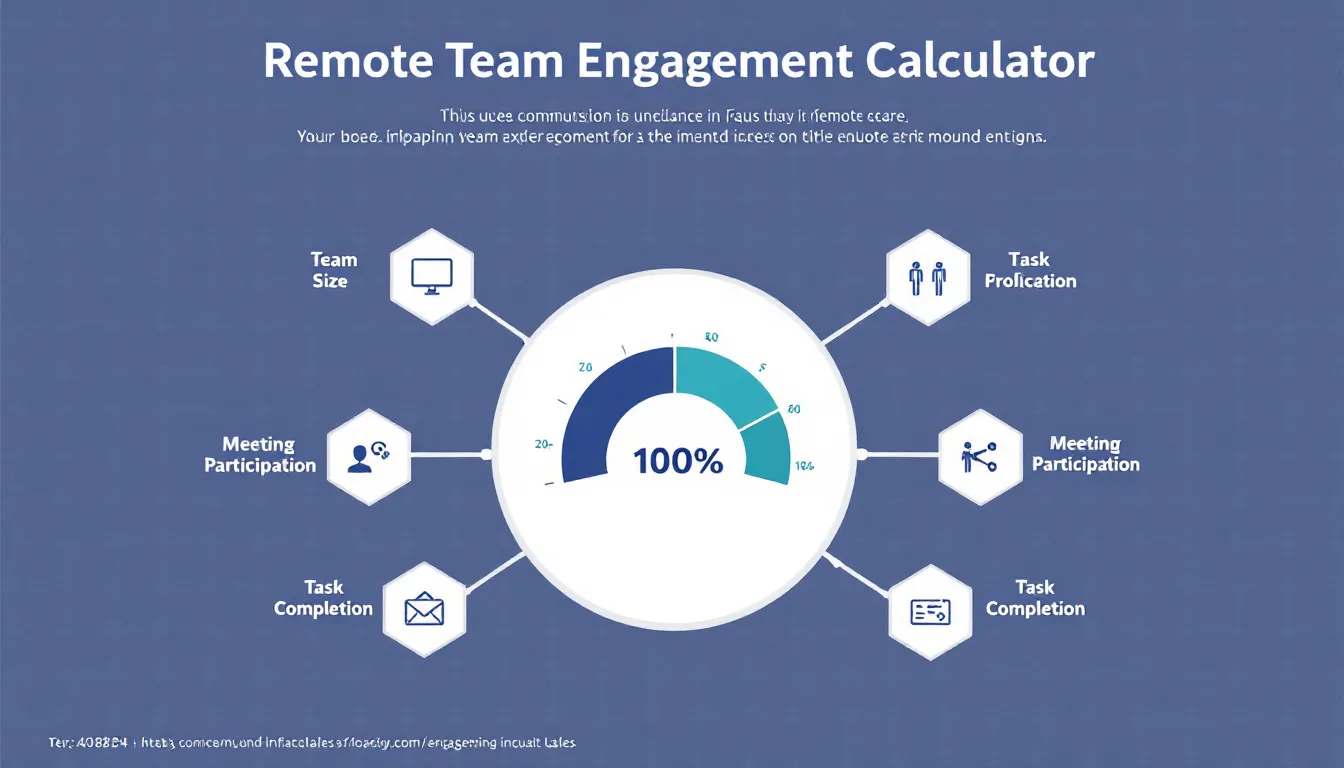
Remote Team Engagement Score Calculator
Calculating...
Is this tool helpful?
How to Use the Remote Team Engagement Score Calculator Effectively
This comprehensive calculator helps measure and analyze remote team engagement through several key metrics. Here’s how to use each field:
Input Fields Guide
- Number of team members: Enter the total count of people in your remote team. For instance, enter 15 for a mid-sized development team or 35 for a larger customer service department.
- Communications per week: Input the average number of messages, emails, or calls per team member weekly. Example: 65 for a highly communicative marketing team or 30 for a research team.
- Meeting participation rate: Enter the percentage of team meetings attended. If team members attend 18 out of 20 scheduled meetings, enter 90.
- Task completion rate: Input the percentage of tasks completed on time. For example, if 85 out of 100 tasks are completed by deadlines, enter 85.
- Employee satisfaction score: Enter the average satisfaction rating from surveys (1-5 scale). For instance, 4.3 indicates high satisfaction, while 3.2 suggests room for improvement.
- Response time: Input the average hours taken to respond to messages. Optional field – enter 1.5 for quick responses or 4 for longer response times.
- Collaboration index: Enter the percentage of collaborative tasks participated in. Optional – input 75 if team members engage in 3 out of 4 collaborative opportunities.
- Custom weights: Optionally adjust the importance of each factor by entering comma-separated values totaling 100.
Understanding the Remote Team Engagement Score Calculator
The Remote Team Engagement Score Calculator is an advanced analytical tool designed to quantify and evaluate the engagement levels within distributed teams. It processes multiple engagement indicators to generate a comprehensive score that reflects team dynamics, participation, and overall effectiveness.
Mathematical Foundation
The calculator uses the following formula to compute the engagement score:
$$ES = \sum_{i=1}^n w_i \times F_i$$Where:
- ES = Engagement Score
- w_i = Weight of factor i
- F_i = Normalized value of factor i
- n = Number of factors
Benefits of Using the Remote Team Engagement Calculator
- Data-Driven Decision Making: Transform qualitative observations into quantifiable metrics
- Trend Analysis: Track engagement patterns over time to identify improvements or concerns
- Objective Evaluation: Remove subjective bias from team performance assessment
- Resource Optimization: Identify areas requiring additional support or intervention
- Team Development: Create targeted strategies for improving engagement
Solving Remote Team Management Challenges
Example Calculation
Consider a software development team with these metrics:
- Team Size: 12 members
- Communication Frequency: 45 messages/week
- Meeting Participation: 88%
- Task Completion: 92%
- Satisfaction Score: 4.5
- Response Time: 2.3 hours
- Collaboration Index: 78%
The calculator normalizes these values and applies weights to compute the final score:
$$Normalized\ Score = (45/100 \times 0.2) + (88/100 \times 0.15) + (92/100 \times 0.15) + (4.5/5 \times 0.15) + (1-(2.3/24) \times 0.1) + (78/100 \times 0.15)$$Practical Applications and Use Cases
Team Performance Optimization
- Quarterly Reviews: Compare team engagement across different periods
- Department Benchmarking: Establish baseline metrics for different team types
- Performance Improvement: Create targeted intervention strategies
Management Decision Support
- Resource Allocation: Identify teams needing additional support
- Training Needs: Determine areas requiring skill development
- Culture Building: Develop strategies for improving team cohesion
Frequently Asked Questions
What is a good engagement score?
A score above 75% typically indicates strong team engagement. However, context matters – technical teams might have different optimal ranges than creative teams.
How often should I measure team engagement?
Monthly or quarterly measurements provide meaningful trend data while avoiding survey fatigue.
Can I customize the weights for different team types?
Yes, adjust weights to reflect your team’s priorities. For example, development teams might weight task completion higher, while support teams might prioritize response time.
How do I interpret the collaboration index?
The collaboration index reflects team member participation in joint projects. A score above 70% suggests strong collaborative practices.
Should I share the results with my team?
Transparency can foster improvement. Share aggregated results and use them to facilitate constructive discussions about team dynamics.
How can I improve low scores?
Focus on the lowest-scoring metrics first. Implement targeted improvements like communication workshops or workflow optimization based on specific metrics.
Is this suitable for all remote team sizes?
The calculator is effective for teams from 5 to 500 members, with weights and metrics remaining relevant across different team scales.
How do seasonal variations affect the score?
Consider tracking scores over longer periods to account for natural variations in team activity during different business cycles.
Important Disclaimer
The calculations, results, and content provided by our tools are not guaranteed to be accurate, complete, or reliable. Users are responsible for verifying and interpreting the results. Our content and tools may contain errors, biases, or inconsistencies. We reserve the right to save inputs and outputs from our tools for the purposes of error debugging, bias identification, and performance improvement. External companies providing AI models used in our tools may also save and process data in accordance with their own policies. By using our tools, you consent to this data collection and processing. We reserve the right to limit the usage of our tools based on current usability factors. By using our tools, you acknowledge that you have read, understood, and agreed to this disclaimer. You accept the inherent risks and limitations associated with the use of our tools and services.


