Rent vs. Buy Calculator
Is this tool helpful?
How to Use the Rent vs. Buy Calculator Effectively
This Rent vs. Buy Calculator is designed to help you make smart, data-driven decisions about your housing options. To get the most accurate and personalized comparison, follow these steps when entering your information:
- Enter Home Price: Provide the estimated purchase price of the home you are considering. For example, try $250,000 or $450,000.
- Specify Down Payment: Input the initial amount you plan to pay upfront. Common examples are $50,000 or $90,000, representing roughly 20% down.
- Set Loan Term: Choose your mortgage duration in years. Typical choices are 15 or 25 years.
- Input Annual Interest Rate: Enter your expected yearly mortgage interest rate. For instance, use 3.75% or 5.2%.
- Provide Property Tax Rate: Enter the annual property tax as a percentage of the home’s value. Common values include 1.1% or 1.5%.
- Enter Homeowners Insurance: Specify the typical yearly insurance cost. Examples are $900 or $1,500.
- Estimate Maintenance Costs: Input annual maintenance expenses as a percentage of home value, such as 1.2% or 0.8%.
- Specify Closing Costs: Provide closing costs as a percentage of the home price, like 2.5% or 4%.
- Estimate Selling Costs: Enter anticipated costs for selling, usually around 5% or 7% of the future home value.
- Project Home Appreciation: Input your expected annual home value growth rate, for example, 3% or 1.5%.
- Enter Initial Monthly Rent: Specify your current or forecasted rent payment. Sample entries are $1,200 or $2,100.
- Estimate Annual Rent Increase: Provide the expected percentage increase in rent per year, such as 2.5% or 1.8%.
- Provide Investment Return Rate: Enter the anticipated yearly return if you invested money saved by renting. Use examples like 6% or 4.5%.
- Set Time Horizon: Define the number of years to compare renting versus buying, such as 15 or 25 years.
After filling in all required fields, click Calculate to receive a detailed comparison of the financial implications of renting against buying based on your customized inputs.
What Is the Rent vs. Buy Calculator and Why Use It?
The Rent vs. Buy Calculator is a powerful financial planning tool that helps you weigh the costs and benefits of renting a home versus purchasing one over a selected time period. Whether you’re a first-time homebuyer or evaluating long-term housing strategies, this calculator offers a comprehensive view of your options.
Purpose of the Rent vs. Buy Calculator
- Provide a clear and transparent comparison of total costs for renting and buying.
- Incorporate important factors like mortgage interest, property taxes, maintenance, insurance, and transaction fees.
- Account for rent increases and potential investment returns if funds remain invested instead of tied up in home equity.
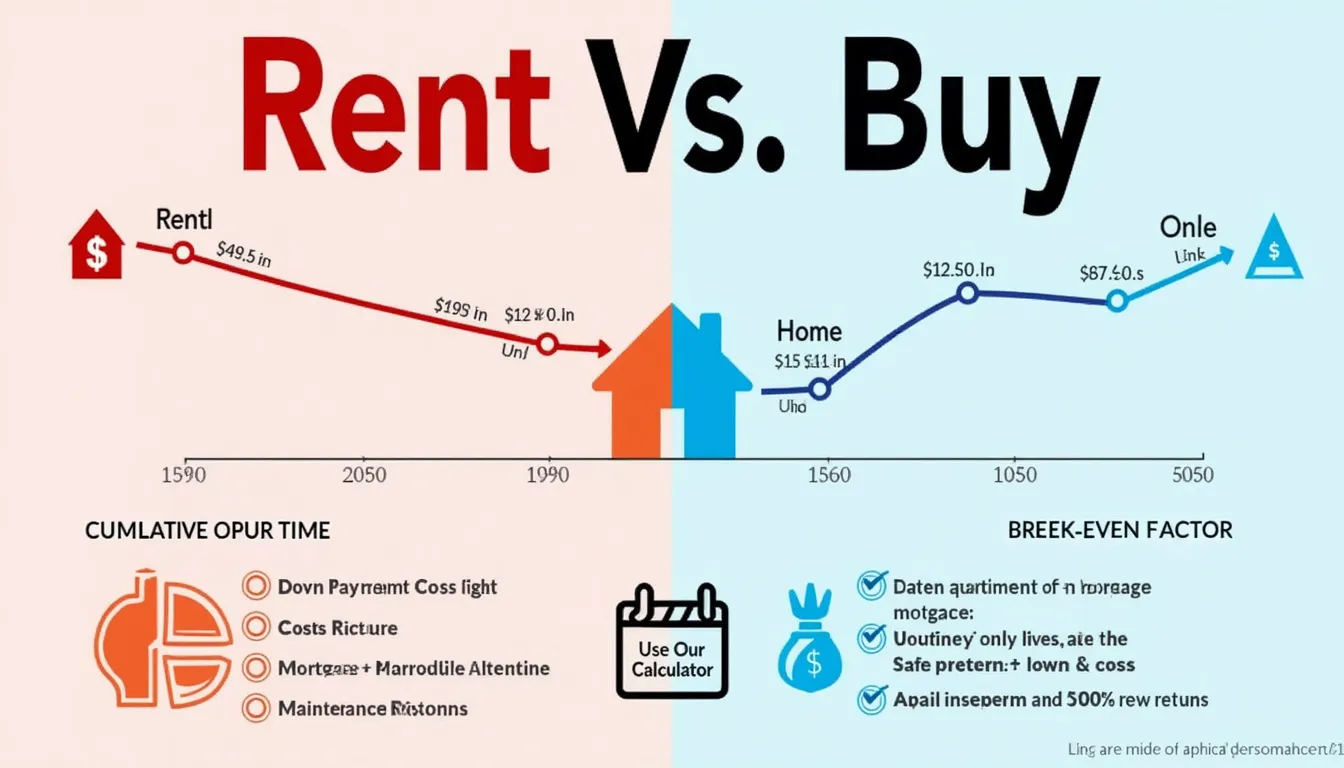
- Help identify the break-even point when buying becomes more financially advantageous than renting.
- Visualize cumulative costs over your selected time horizon with easy-to-understand charts.
Key Benefits of Using This Housing Cost Comparison Calculator
- Customized Insights: Tailor inputs to your unique financial scenario and local market conditions for personalized results.
- Comprehensive Financial Picture: Goes beyond simple mortgage and rent comparisons by including taxes, maintenance, insurance, and selling costs.
- Long-Term Planning: Assess how your housing expenses evolve over years, considering home appreciation and rent inflation.
- Investment Analysis: Incorporates potential returns on investment from savings generated by renting.
- Easy Visualization: Graphical representation helps you see cost trajectories and make informed decisions.
Example Calculations Using the Rent vs. Buy Calculator
To illustrate, consider the following sample scenario:
- Home Price: $350,000
- Down Payment: $70,000 (20%)
- Loan Term: 30 years
- Interest Rate: 4% annually
- Property Tax Rate: 1.3% per year
- Homeowners Insurance: $1,200 yearly
- Maintenance Costs: 1% of home value per year
- Closing Costs: 3% of home price
- Selling Costs: 6% of future home value
- Expected Home Appreciation: 2.5% annually
- Initial Rent: $1,600 per month
- Annual Rent Increase: 2%
- Investment Return Rate: 5%
- Time Horizon: 20 years
Based on these values, the calculator estimates your monthly mortgage payment using the amortization formula:
$$ M = P \times \frac{r(1 + r)^n}{(1 + r)^n – 1} $$Where:
- M = Monthly mortgage payment
- P = Loan principal (home price minus down payment)
- r = Monthly interest rate (annual rate divided by 12)
- n = Total number of payments (loan term in months)
Over the 20-year horizon, the tool aggregates costs such as mortgage payments, property taxes, insurance, maintenance, and transaction fees for buying. Simultaneously, it calculates renting costs accounting for rent increases and investment growth on saved down payment funds.
The break-even point pinpoints when cumulative buying costs become lower than renting costs, helping you determine the financial tipping point for homeownership versus renting.
By leveraging this detailed financial comparison, you can confidently decide the best housing choice that aligns with your economic goals and personal circumstances.
Important Disclaimer
The calculations, results, and content provided by our tools are not guaranteed to be accurate, complete, or reliable. Users are responsible for verifying and interpreting the results. Our content and tools may contain errors, biases, or inconsistencies. Do not enter personal data, sensitive information, or personally identifiable information in our web forms or tools. Such data entry violates our terms of service and may result in unauthorized disclosure to third parties. We reserve the right to save inputs and outputs from our tools for the purposes of error debugging, bias identification, and performance improvement. External companies providing AI models used in our tools may also save and process data in accordance with their own policies. By using our tools, you consent to this data collection and processing. We reserve the right to limit the usage of our tools based on current usability factors.
